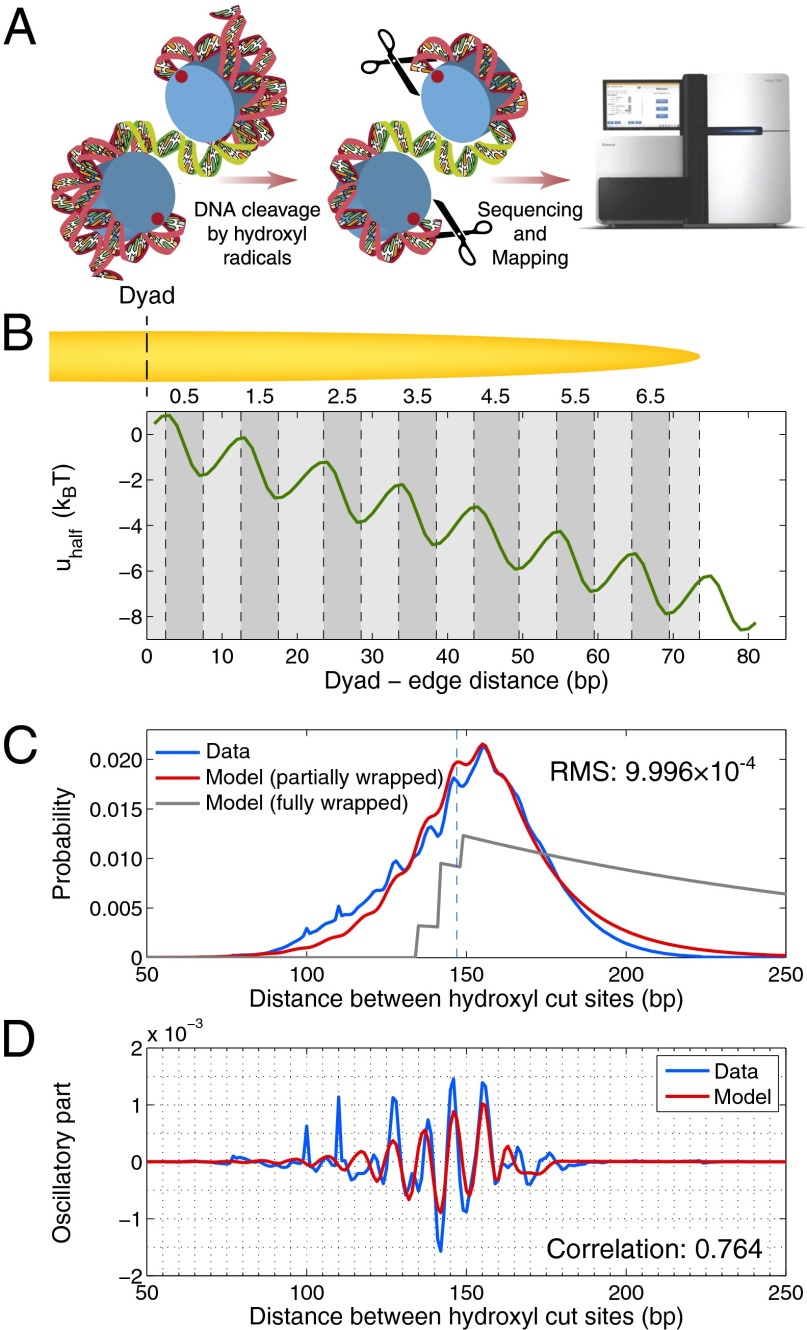
Fig. 1.
Genome-wide distribution of distances between hydroxyl cut sites marking neighboring nucleosomes. (A) Overview of the chemical method for mapping nucleosome dyad positions and interdyad distances (4, 23). Mutant H4 histones (S47C) were modified by covalent attachment of a sulfhydryl-reactive, copper-chelating label to the cysteines. With the addition of copper and hydrogen peroxide, a localized cloud of hydroxyl radicals was produced that specifically cleaved the DNA backbone at sites symmetrically flanking nucleosome dyads. The cleavage products that correspond to DNA fragments linking neighboring nucleosomes were size-selected on an agarose gel, purified, sequenced using paired-end reads, and mapped to the S. cerevisiae genome. Note that the size-selection step likely causes depletion of very short and very long fragments from the sample. Each mapped pair of reads yields a measurement (biased by hydroxyl cleavage preferences) of the distance between dyads of neighboring nucleosomes positioned on the same chromosome. In the dinucleosome conformation shown, the interdyad distance is 100 bp (dyads are marked by red dots). Starting from the top dyad, 40 bp of DNA are wrapped around the histone octamer, followed by a 30-bp linker (green) and by 30 bp of DNA wrapped around the other octamer. (B) Histone–DNA binding/higher-order structure energy profile. The energy of a DNA segment  bp in length positioned symmetrically with respect to the dyad is given by
  . The minima and maxima of the energy landscape are based on a crystal structure of the nucleosome core particle (9, 10). Dark gray bars show where the histone binding motifs interact with the DNA minor groove in the structure. Light gray bars show where the DNA major groove faces the histones. The energy profile was obtained by a polynomial fit (SI Appendix, Model A). (C) Normalized histogram of DNA fragment lengths from the high-resolution chemical map described in A (4) (blue) and from the models with partially (red) and fully (gray) wrapped DNA. In the latter,
  . RMS, total root-mean-square deviation between the model and the data. (D) Oscillations in the observed (blue) and predicted (red) distributions of DNA fragment lengths, obtained by subtracting a smooth background from the data and the model with partially wrapped DNA in C. The smooth background was found by applying a Savitzky–Golay filter of polynomial order 3 with 31-bp length. Correlation refers to rosc, the linear correlation coefficient between measured and predicted oscillations.

