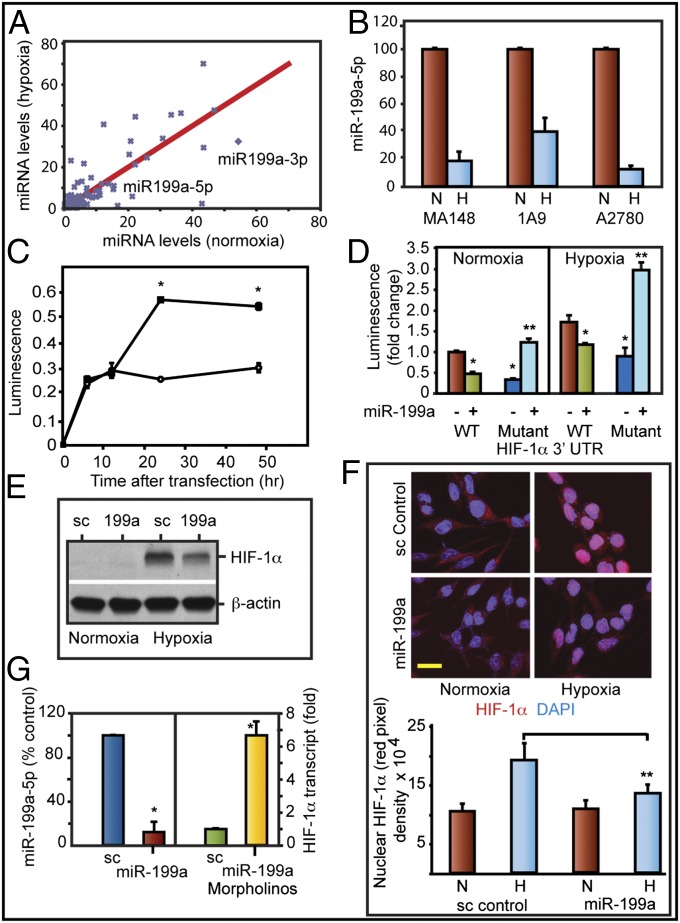
Fig. 3.
Overexpression of miR-199a targets HIF1α. (A) Custom micro-RNA array was used to determine changes in miR expression. (B) miR-199a-5p levels (qPCR) in normoxia (N) or hypoxia (H). Values represent mean ± SD from three independent experiments. *P < 0.05. (C) Luciferase- HIF-1α 3′-UTR (Luc-HIF-1α 3′-UTR) was used as reporter in normoxia (❍) or hypoxia (•). (D) Luc-HIF1α 3′-UTR and mutant HIF-1α 3′-UTR (seed sequence deletion) were used to determine miR-199a targeting. (E) Western blot shows inhibition of HIF-1α levels by miR-199a duplex. (F) Confocal images of HIF-1α nuclear translocation. HIF-1α (red) and nuclei (DAPI; blue). (Scale bar: 10 μm.) Histogram shows mean density of red pixel (HIF-1α)/nuclei. (G) Relative levels of miR-199a-5p (Left) and HIF-1α transcript (Right) in A2780 cells after treatment with control morpholino or miR-199a–specific morpholinos. Values represent mean ± SD from three independent determinations. *P < 0.05. **P < 0.001.

