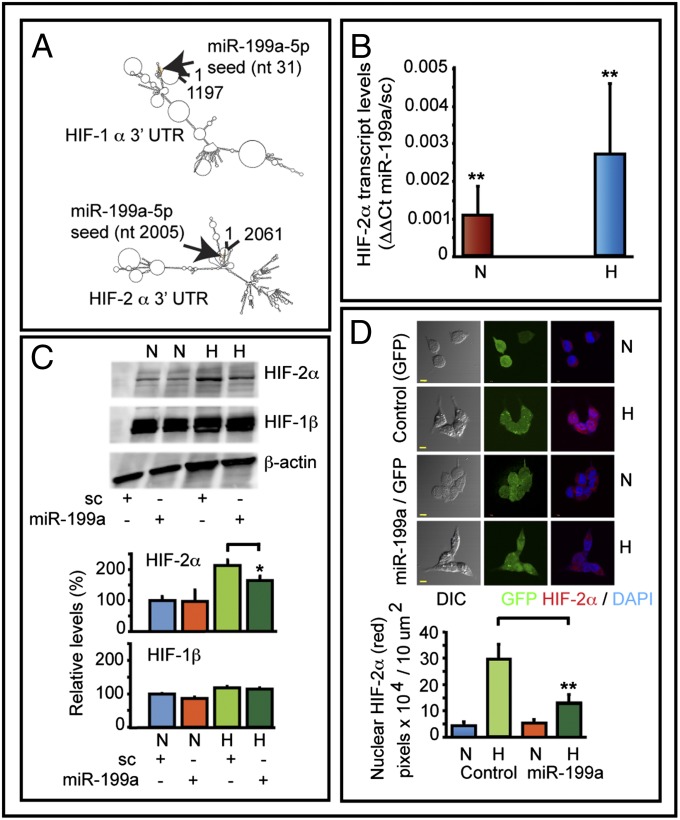
Fig. 4.
Effect of miR-199a on HIF-2α. (A) RNA-fold secondary structure prediction analyses of HIF-1α and HIF-2α 3′-UTR. (B) Transfection of miR-199a decreased HIF-2α transcript levels as determined by qPCR. Data show ΔΔCt values comparing transcript levels between miR-199a–transfected and control duplex (sc) transfected cells. Values represent three independent transfections. (C) Representative Western blots of HIF-2α and HIF-1β of control and miR-199a duplex transfected cells are shown. (D) Confocal images show hypoxia-induced nuclear translocation of HIF-2α was inhibited by miR-199a. A2780 cells were infected with a lentivirus construct to express either GFP alone or coexpress miR-199a and GFP. Histogram shows quantification of red pixel (HIF-2α) localized to 10 μm2 of nuclei. (Scale bars: 10 μm.)

