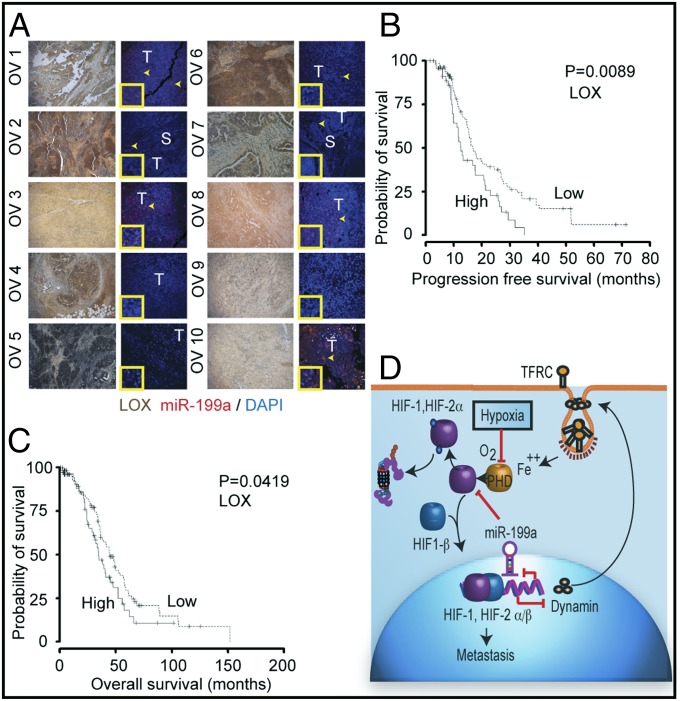
Fig. 7.
miR-199a expression in tissue samples from EOC patients and LOX expression. (A) Representative images of LOX expression and miR-199a in EOC. LOX staining (brown; lanes 1 and 3) and miR-199a in situ hybridization (red; lanes 2 and 4). The arrows indicate areas of miR-199a in situ hybridization. S, stroma; T, tumor. (Inset) Magnified area showing hybridization signal. (B) Kaplan–Meier plot of EOC patient TCGA data correlating LOX expression to progression-free survival (solid line, high LOX) (dashed line, low LOX). (C) Overall survival of ovarian cancer patients as related to LOX expression. (D) Schematic diagram showing reciprocal regulation of endocytic pathway (DNM) and HIF through miR-199a.

