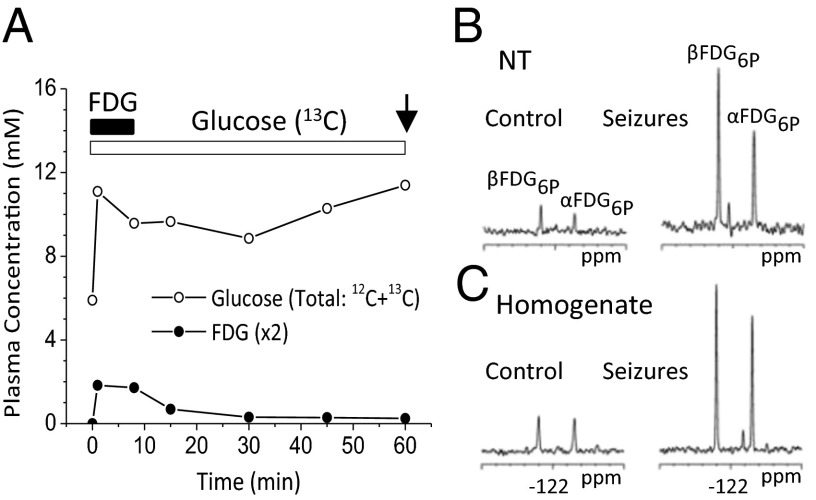
Fig. 2.
Time courses of blood FDG and glucose concentrations during FDG/[1,6-13C2] glucose infusion (A) and 19F NMR spectra of nerve terminal (NT) (B) and homogenate (C) extracts for control and seizure conditions. FDG was infused for 8 min (solid bar) and [1,6-13C2] glucose for 60 min (open bar) followed by euthanasia and nerve terminal preparation (arrow). α,βFDG6P, 2-fluoro-2-deoxyglucose-6-phosphate; with resolved C1 α and β anomers.

