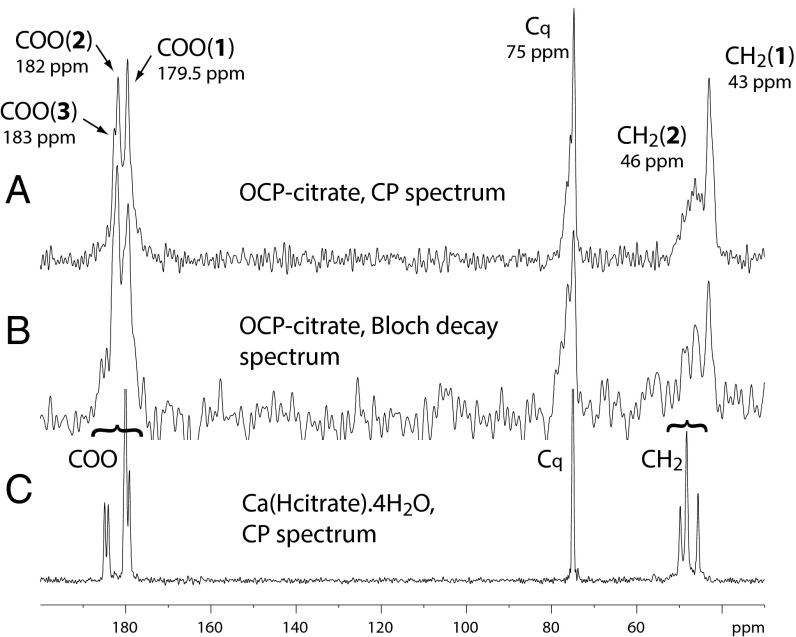
Fig. 3.
(A) The 13C CP spectrum (contact time of 1 ms) and (B) the 13C BD spectrum of OCP-citrate. (C) The 13C CP spectrum of Ca(Hcitrate).4H2O (contact time of 3 ms) is included for comparison. The signals are labeled as discussed in the text and with the chemical shift at the maximum intensity of the signal.

