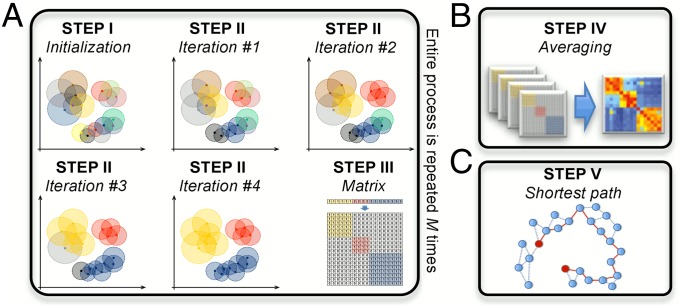
Fig. 1.
(A) The KODAMA accuracy maximization procedure is illustrated for 2D data points, where kNN (with k = 2) classifier was used. Each point is colored according to the cluster it belongs to; the circle represents its distance to the second-nearest neighbor. More details are shown in SI Appendix, Fig. S2. (B) In the fourth step the matrices are averaged. More details are shown in SI Appendix, Fig. S3. (C) In the fifth step the shortest path is calculated.

