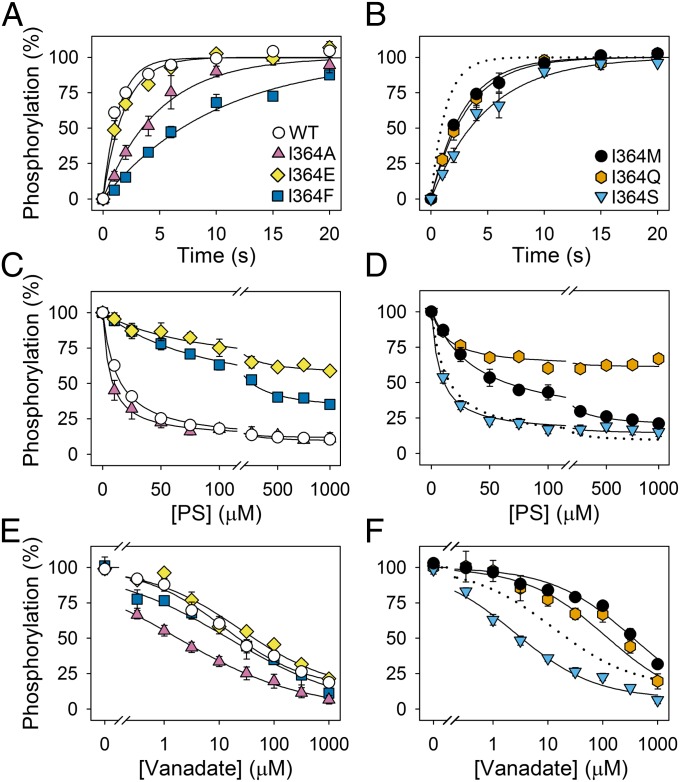
Fig. 3.
Phosphorylation, dephosphorylation, and vanadate sensitivity of WT and I364 mutants. (A and B) Enzyme reconstituted in PC was phosphorylated at 0 °C with [γ-32P]ATP in standard phosphorylation medium (SPM) without CHAPS, quenched after the indicated time intervals, and the phosphoenzyme was quantified by phosphoimaging following acidic SDS/PAGE. The 100% value corresponds to maximum phosphorylation, defined by the exponential curve fitting. (C and D) Following phosphorylation of PC-reconstituted enzyme at 0 °C with [γ-32P]ATP in SPM containing CHAPS for 30 s, PS mixed with PC dissolved in CHAPS was added to provide the indicated PS concentrations, and dephosphorylation was terminated 5 s later. The 100% value represents the phosphorylation level 5 s after addition of PC dissolved in CHAPS without PS. No dephosphorylation was observed in the latter condition (12). (E and F) Enzyme reconstituted in PC was incubated at 25 °C with the indicated concentrations of orthovanadate in SPM containing CHAPS for 30 min and subsequently phosphorylated with [γ-32P]ATP at 0 °C. The phosphorylation obtained following incubation in the absence of vanadate was taken as 100%. In C–F, the symbols for mutants are the same as in A and B. Error bars show SEs. Dotted lines reproduce the data for WT. Refer to Table 2 for statistical analysis.

