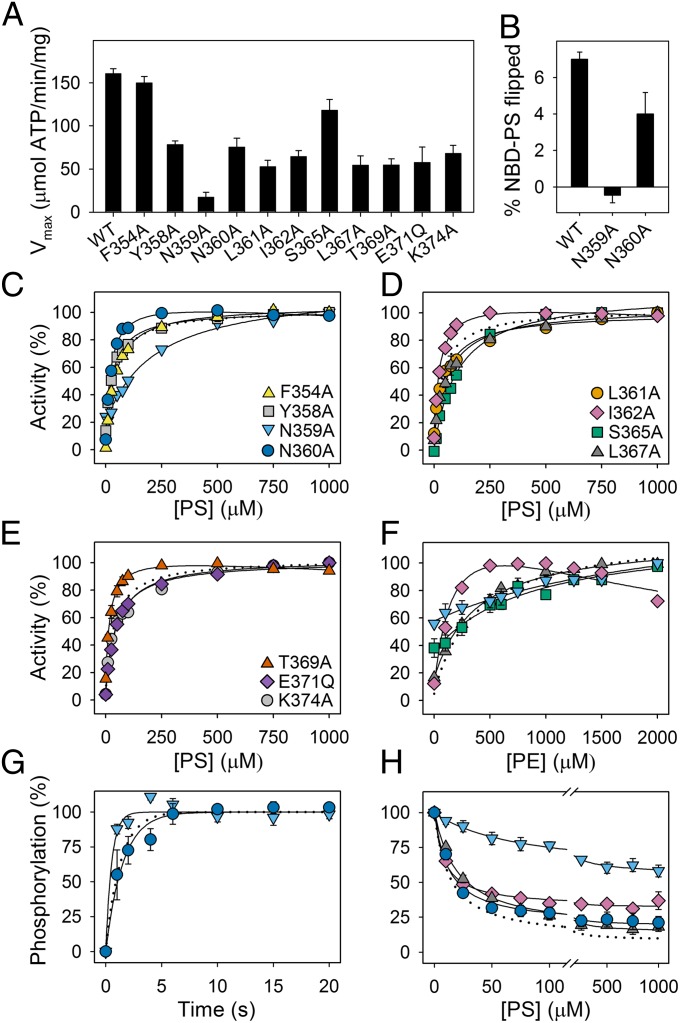
Fig. 4.
Functional analysis of other M4 mutants. Maximal ATPase activities in the presence of PC and CHAPS and the optimal concentration of PS (A), flippase activity (B), PS and PE concentration dependences of the ATPase activity (C–F), phosphorylation (G), and dephosphorylation (H) of WT and mutant enzymes, determined as described for Figs. 2 and 3. Error bars show SEs when larger than symbols. Dotted lines reproduce the data for WT. Refer to Tables 1 and 2 for statistical analysis. Symbols for mutants are the same in F–H as in C–E.

