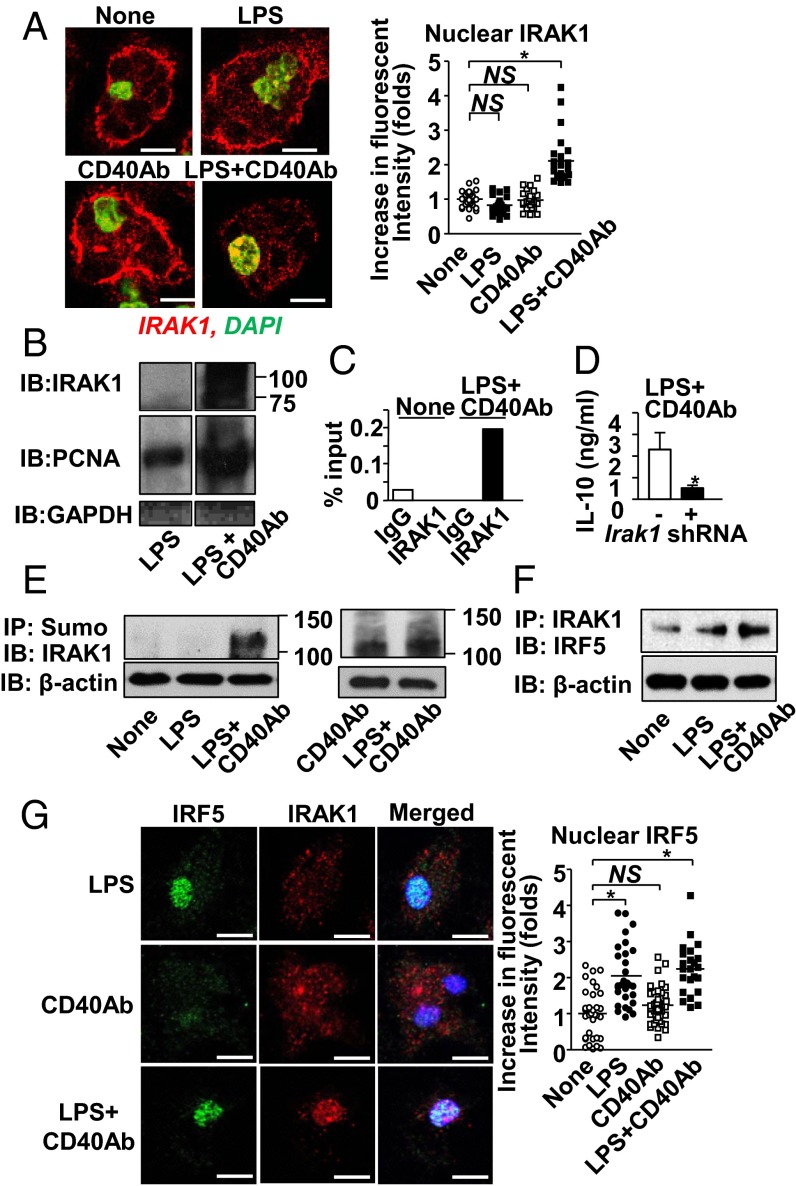
Fig. 4.
Costimulation of CD40 and TLR4 induces IRAK1-mediated Il10 gene expression. (A, Left) Representative confocal microscopic images of IRAK1 after LPS, CD40 Ab, or LPS plus CD40 Ab for 60 min. (Right) Fluorescent intensities of IRAK1 in nuclei were calculated relative to the average value of unstimulated cells using the Fiji software. One circle or square denotes a result from one cell. (B) Detection of IRAK1 in nuclear lysates from macrophages harvested 30 min after cell treatment with LPS alone or with LPS plus CD40 Ab. Proliferating cell nuclear antigen (PCNA) and GAPDH are markers of the nuclei and cytosol, respectively. Images came from the identical blot. Order of bands was rearranged from the original film for presentation. (C) ChIP assay for the IRAK1 binding to the Il10 promoter. IgG was used as an isotype control of IRAK1 Ab. (D) IL-10 expression by macrophages stimulated with LPS plus CD40 Ab for 24 h with or without Irak1 shRNA. Data are presented as mean ± SEM (n = 4 per group). (E and F) Evaluating IRAK1 sumoylation (E), and coimmunoprecipitation (co-IP) between IRF5 and IRAK1 (F) in macrophages with indicated stimulation. Hereafter, we used β-actin as the internal input control for some immunoprecipitation (IP) experiments, in which Western detection of molecules targeted for IP was considered to show many bands due to posttranslational modifications. (G) Nuclear translocation of IRF5 and IRAK1 after cell stimulation with LPS, CD40 Ab, or LPS plus CD40 Ab for 60 min. DAPI (blue) for nuclear staining and fluorescent intensities of IRF5 in nucleus. Final concentrations of LPS and Ab/IgG in tissue culture were 100 ng/mL and 10 µg/mL, respectively. (Scale bars in A and G, 5 μm.) *P < 0.05.

