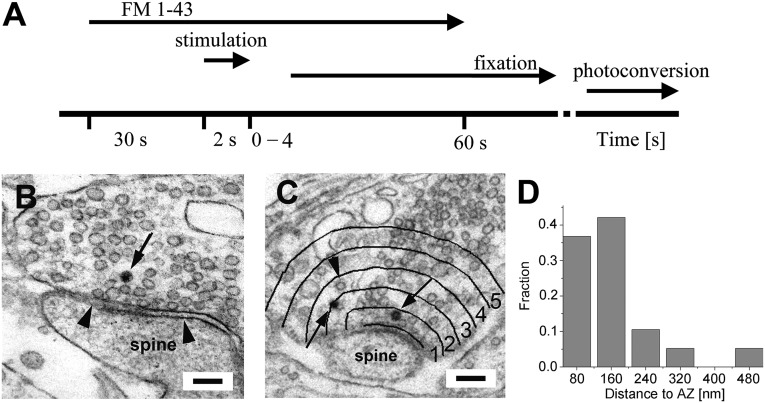
Fig. 1.
Experimental rationale and the first labeled endocytic vesicles 4 s after stimulation. (A) The timeline of experiments. Dye is presented 30 s before electrical field stimulation for 2 s. Samples were rapidly fixed by using microwave-assisted fixation at various time points (0–60 s). The fluorescence trapped in endocytic vesicles after membrane retrieval was photoconverted, and the specimens were processed for 3D EM. (B) A synapse of a cultured hippocampal neuron that was labeled with FM1–43 and fixed 4 s after stimulation. The arrowheads indicate the postsynaptic density inside a spine. The arrow points at one labeled vesicle that still hoovers above the active zone. (Scale bar: 100 nm.) (C) An example of the compartments drawn to quantify the location of the earliest labeled vesicles. Compartments have a width of 80 nm. Two labeled vesicles (arrows) are shown that are still very close to the active zone. The arrowhead points at an unlabeled coated vesicle. (Scale bar: 150 nm.) (D) Relative frequency histogram of labeled vesicles in each compartment. The actual distance from the active zone (AZ) is indicated on the x axis for each compartment: 80 nm for the first compartment, 160 for the second, and so on. Almost 80% of all labeled vesicles were found within the two compartments closest to the active zone.

