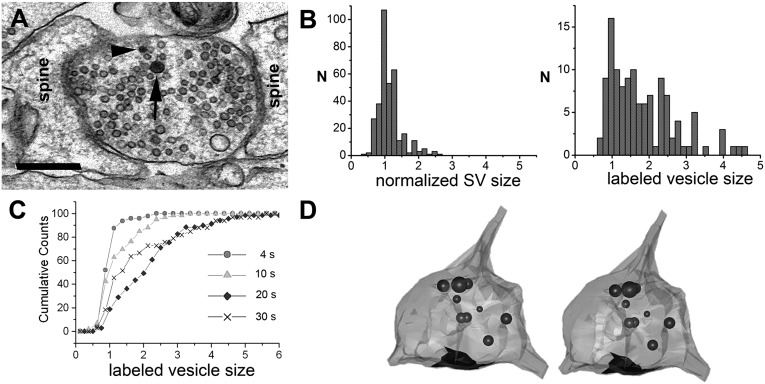
Fig. 3.
Large labeled vesicles appear 10 s after stimulation. (A) A synaptic profile that was fixed 10 s after stimulation. The presynaptic bouton is contacted by two spines. The arrowhead points at a labeled small endocytic vesicle. The arrow indicates a large labeled vesicle. (Scale bar: 400 nm.) (B) Frequency histogram of electron lucent SV (Left) and labeled (Right) vesicle size 10 s after stimulation. The x axis indicates SV size normalized to the average size of SVs for each synapse (for details, see Fixation After 10 s). Labeled vesicle size (Left) is up to four times the size of SVs within the same bouton. (C) Cumulative frequency histogram of labeled vesicle sizes at different fixation times. At 4 s, all labeled vesicles have the same size as typical SVs. The number of large vesicles increases until 20 s after stimulation. At later time points (30 s) large vesicles decrease and small vesicles increase proportionally. The histograms are significantly different from each other (Kolmogorov–Smirnov test, P < 0.01 for 4 s compared with 10 s and 10 s to 20 s; P < 0.05 for 20 s to 30 s). (D) Localization of large labeled vesicle 20 s after stimulation, and a pair of images for stereoviewing of a 3D rendering of a presynaptic bouton 20 s after stimulation. Labeled vesicles are shown as spheres with a diameter corresponding to the area measurements in EM graphs. The black area at the bouton indicates the active zone. Note that large vesicles are closer to the plasma membrane surrounding the SV cluster in the center. The SV cluster is omitted for clarity.

