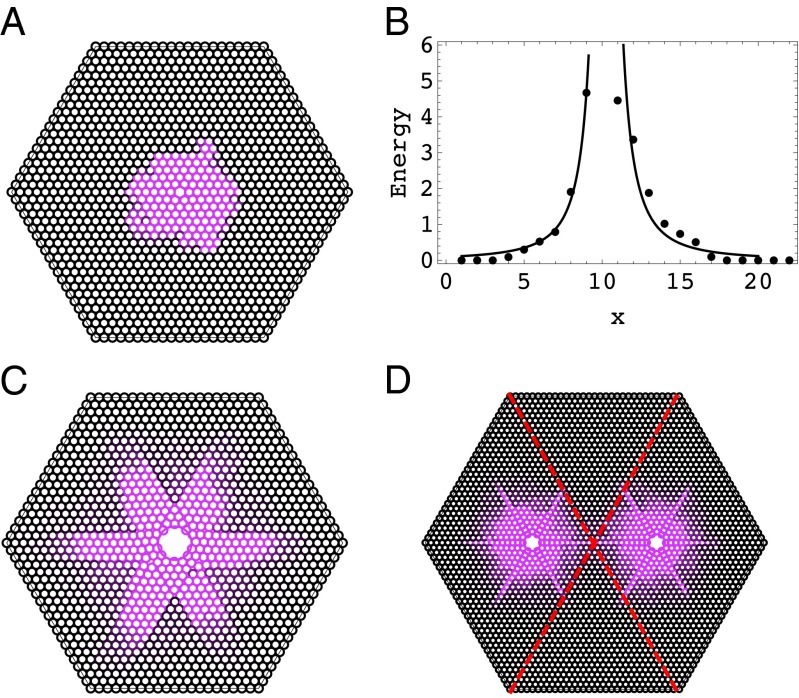
Fig. 1.
Impurity particles represented by circles of larger sizes induce stresses on surrounding particles which are colored. The branching of the stressed colored region occurs as Γ increases from 1.3 (A) to 4.0 (C). The decay of the particle energy away from the central impurity particle is plotted in B for the system A, where  prescribes the location of the impurity particle. The energy, which is measured in the unit of ϵ defined in the expression for the Hertz potential, is rescaled by a factor of 104, and the x axis is in the unit of
  . The two curves conform to a power law. The branched structures around two impurity particles are shown in D for
  . The number of particles is
  (A and C) and
  (D).
(D).

