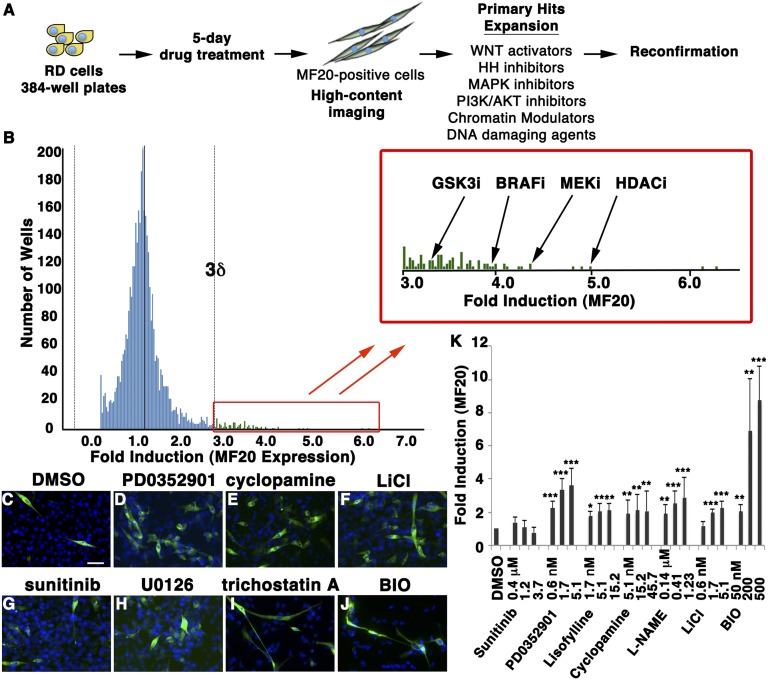
Fig. 1.
A large-scale, high-content imaging screen identifies compounds that induce differentiation of human ERMS cells. (A) Schematic of the experimental design. (B) Results for the differentiation screen. Lead compounds that increase the frequency of MF20-expressing RD cells are shown in the magnified box (>3δ). (C–J) Representative images of the MF20 (green) and DAPI (blue) staining in drug-treated cells. Control (DMSO, C) and a negative control compound (sunitinib, G) are shown. Blue, DAPI staining. (K) Quantification of MF20 induction in treated RD cells. Error bars denote ±1 SD. *P < 0.005; **P < 0.001; ***P < 0.0005.

