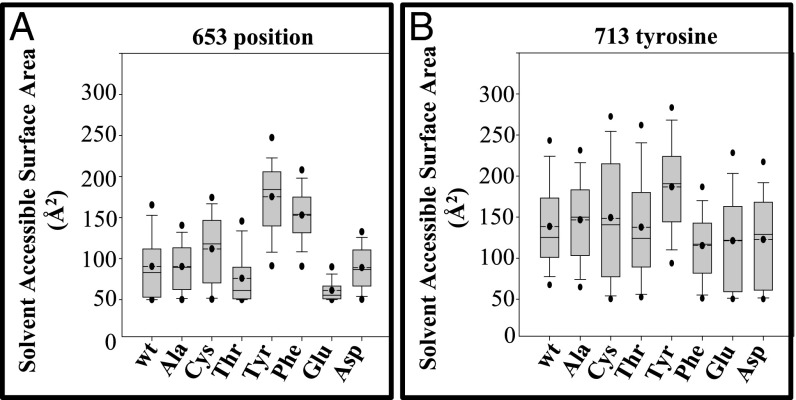
Fig. 6.
Molecular dynamic simulation of Ser653 mutant proteins reveals fluctuations in the SASA. (A) Box plots show fluctuations of SASAs at the 653 position in wild-type and mutant (Ala, Cys, Thr, Tyr, Phe, Glu, and Asp) substituted models. Tyr and Phe mutants are more exposed and Glu is buried within the structure. (B) Box plots showing fluctuations of SASAs at the 713 tyrosine in wild-type and mutant (Ala, Cys, Thr, Tyr, Phe, Glu, and Asp) substituted models. Solid line represents median; dashed line with dot represents average; upper dot represents value at 95%; lower dot represents value at 5%; error bars are shown. The 95th and 5th percentile datapoints represent the sampling extremes.

