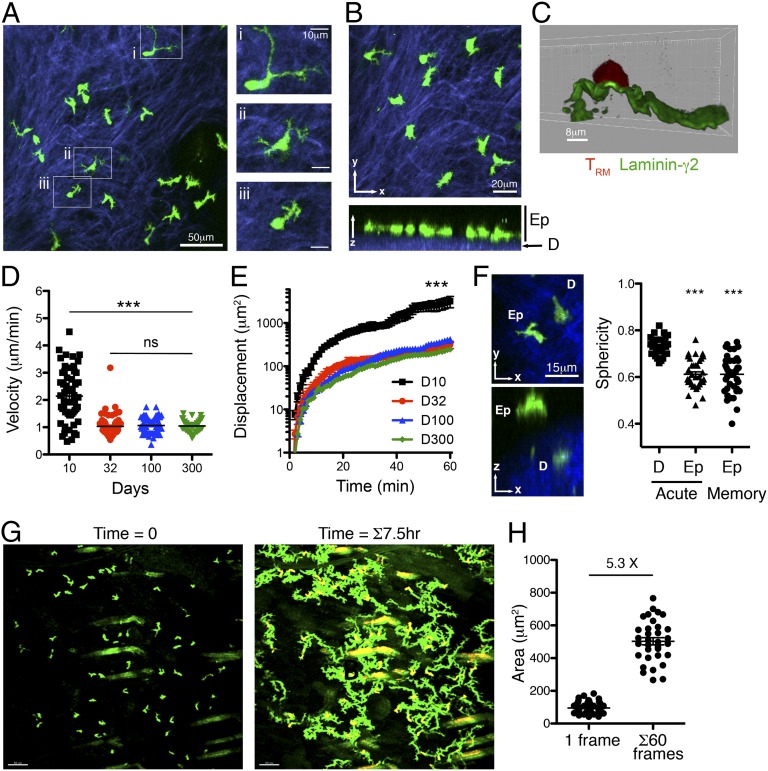
Fig. 1.
Migration of skin TRM at the site of prior infection. (A) gBT-I.GFP CD8+ T cells (green) imaged by two-photon microscopy in the skin 32 d after HSV infection. Examples of different cell morphologies are magnified in i–iii. SHG (blue) delineates the collagen-rich dermis. Images correspond to Movie S1. (B) TRM are located within the basal epidermis (Ep), adjacent to the SHG+ dermis (D). (C) TRM contact the basement membrane at the dermis–epidermal border. Tissue sections of skin containing gBT-I.DsRed CD8+ T cells were costained with anti-laminin-γ2 antibodies. (D) Mean velocity and (E) displacement of TRM migrating within the epidermis at the indicated times after HSV infection. ***P < 0.0001; ns, not significant. (F) Epidermal location defines the dendritic morphology of skin TRM. Shown is a representative example of an epidermal and a dermal gBT-I T-cell 10 d after HSV infection. Sphericity measurements of dermal and epidermal gBT-I T cells 10 d (acute) and 32 d (memory) after HSV infection are plotted. (G) Time-lapse imaging of gBT-I TRM migration in the skin. (Left) The first frame of the movie; (Right) superimposed images taken at 3-min intervals over a 7.5-h period. Images correspond to Movie S4. (H) The average 2D surface area of individual TRM was calculated from 10 individual images per cell collected over a 60-min period. The total surface area covered per cell was calculated from superimposed images taken each minute for 1 h. The fold difference between the average surface area at time 0 and 60 is shown.

