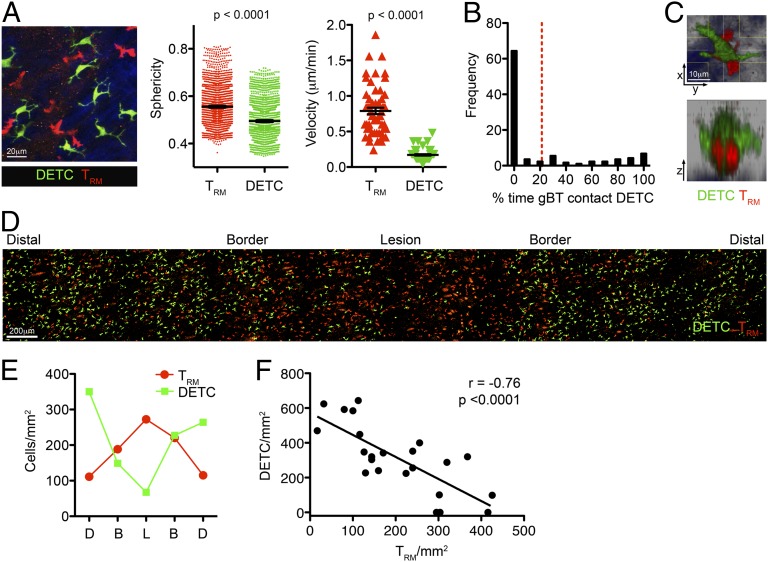
Fig. 4.
TRM displace DETCs at the site of infection. (A) Two-photon microscopy of TRM and DETCs in the skin 30 d after HSV infection. A representative maximum intensity projection at the border of the lesion is shown. The sphericity and mean velocity of gBT-I.DsRed TRM and CXCR6GFP/+ DETC is shown. n = 6 mice. (B) Quantitation of the frequency of contacts between TRM and DETCs. Images were acquired at 1-min intervals for 45–60 min. Data are compiled from 158 TRM imaged from four mice. (C) TRM migrating in the epidermis can travel beneath DETCs. A maximum intensity projection across x, y, and z dimensions is shown. (D and E) TRM displace DETCs in the skin after infection. (D) Image of TRM and DETCs in CXCR6GFP/+ mice 30 d after HSV infection. (E) Quantitation of the density of cells within the indicated regions (B, border; D, distal region; and L, lesion) from the image in D. (F) Inverse correlation between TRM and DETC numbers in the skin after infection. Linear regression line and Pearson’s correlation coefficient (r) are shown. n = 7 mice.

