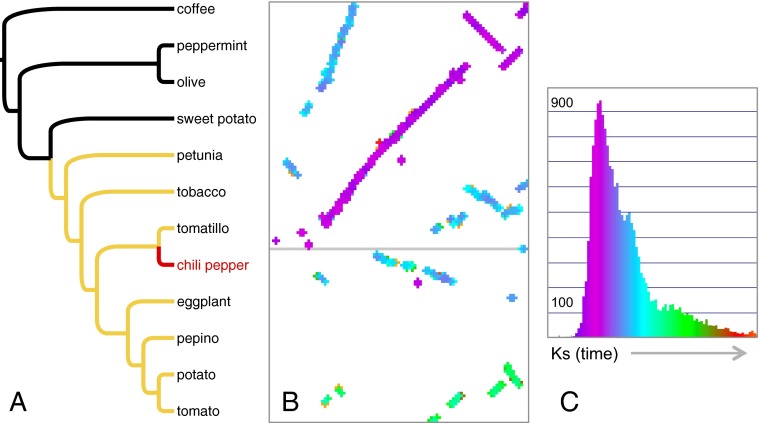
Fig. 1.
The genome of chile pepper in an evolutionary context. (A) A phylogeny of lamiid angiosperms, the family Solanaceae in yellow and chile pepper in red. (B) Syntenic dotplot of tomato chromosome 2 (vertical) versus chiltepin pepper chromosomes 2 (Upper) and 4 (Lower), with syntenic gene duplicates colored according to their Ks values (synonymous substitutions per synonymous site), as plotted in the x axis of C against numbers of gene pairs on the y axis. Ks, increasing along the x axis, is a proxy for time since speciation or gene duplication. Purple, orthologous synteny (youngest); blue, paralogous synteny descending from the triplication observed in Solanaceae; green, paralogous synteny dating to the paleohexaploidy event at the base of core eudicots (oldest). Note corresponding purple, blue, and green peaks in the Ks plot, the latter two subtle.

