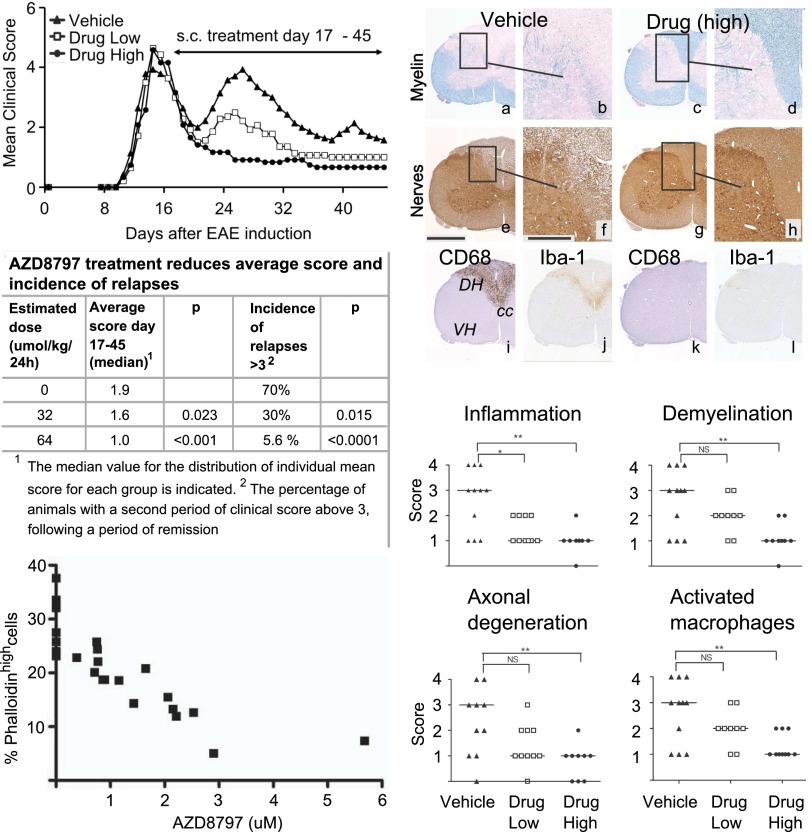
Fig. 4.
AZD8797 treatment in rats with established EAE inhibits development of relapses and all histopathological manifestations of the disease. (Top Left) DA rats with EAE were randomly but evenly distributed into three different groups (n = 20) at day 17 after EAE induction. Groups received AZD8797 or vehicle in s.c. implanted osmotic minipumps (2 × 14 d) at daily doses of either 32 (“drug low”) or 64 µmol/kg (“drug high”). Daily mean clinical score for each group is indicated in the figure. Results in all panels of this figure relates to the same groups of rats. (Bottom Left) Concentration-dependent inhibition of fractalkine-induced actin polymerization in whole blood monocytes from vehicle or AZD8797-treated EAE rats (n = 8). The actin polymerization response was examined by phalloidin-FITC intracellular staining and flow cytometry analysis of CD3−CD4+CD11b/c+ cells. The percentage of cells with induced actin polymerization (phalloidinhigh) versus drug concentration in plasma is presented. The IC50 value was estimated to 1.7 μM. (Middle Left) Statistical comparison between the treatment groups in the EAE study. Therapeutic treatment, starting after the acute phase of EAE, with AZD8797 at 64 µmol/kg resulted in a significant reduction of both clinical score and the incidence of relapses. (Top Right) Representative images of tissue sections from the lumbar spinal cord of rats in the study at termination (Day 45). (a–d) LFB staining of myelin (turquoise), demonstrating normal myelin integrity in the drug-treated rat (c and d), in contrast to the marked loss of myelin present in the spinal cord white matter of the vehicle-treated control (a and b). (e–h) IHC staining using the PGP9.5 antibody specific to ubiquitin–C-terminal hydrolase 1, a protein specifically distributed within neuronal somas, dendrites, and axons. Normal axonal integrity is present in the rat treated with AZD8797 (g and h), whereas the vehicle-treated control displays axonal spheroids in the spinal cord white matter (e and f). (i–l) IHC staining for CD68 (ED-1, phagocytic microglia/activated macrophages) and Iba-1 (microglia/macrophages). Inset rectangles in a, c, e, and g correspond to tissue areas displayed at higher magnification in b, d, f, and h. cc, central canal; DH, dorsal horn; VH, ventral horn. (Middle and Bottom Right) Graphic illustration and statistical analysis of histopathological scoring. Horizontal lines, medians.

