
Fig. 2.
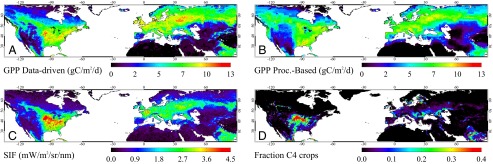
Spatial patterns of maximum monthly gross primary production (GPP) per 0.5° grid box for 2009 from data-driven (A) and process-based (B) models together with maximum monthly SIF at 740 nm (C). The fraction of C4 crop area (mostly corn in this region) depicts the approximate area of the US Corn Belt (D). The data-driven GPP data correspond to the MPI-BGC model (27), the process-based GPP corresponds to the median of an ensemble of 10 global dynamic vegetation models from the Trendy (“Trends in net land-atmosphere carbon exchange over the period 1980−2010”) project (28, 29), and SIF was retrieved from GOME-2 satellite measurements (26). The fraction of C4 crop data are described in Ramankutty et al. (6).