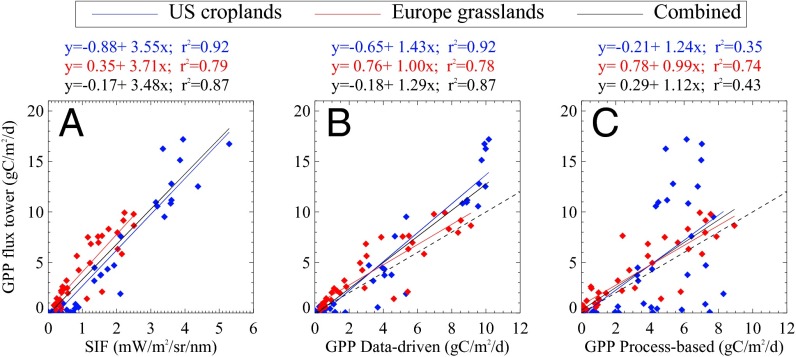
Fig. 3.
Comparison of monthly mean GPP estimates at cropland flux tower sites in the US Corn Belt and grassland sites in Western Europe. Flux tower GPP estimates are compared with sun-induced fluorescence (SIF) observations at 740 nm (A) and with GPP estimates from the MPI-BGC data-driven model (27) (B) and from process-based models [median of an ensemble of 10 dynamic global vegetation models (28, 29)] (C). Each symbol depicts a monthly average for a 0.5° grid box and those months in the 2007–2011 period for which flux tower data were available (see SI Appendix, Table S1). The P value is <0.01 in all of the comparisons. The dashed line in B and C represents the 1:1 line. Similar comparisons but including also Western Europe cropland sites are provided in SI Appendix, Fig. S4.

