Fig. 3.
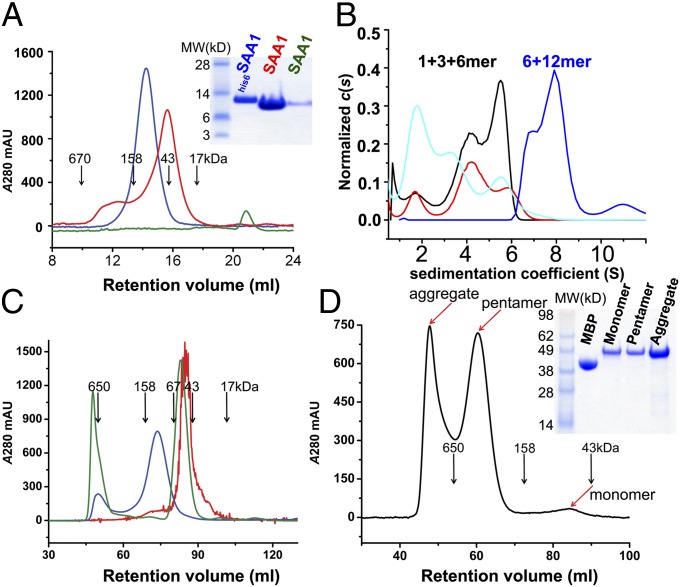
Oligomeric state of SAA1.1. (A) Analytical size-exclusion profiles of his6SAA1.1 (blue), refolded SAA1.1 (red), and ammonium sulfate-treated SAA1.1 (green) on a Superdex 200 10/30 column. (B) Sedimentation coefficient distribution for his6SAA1.1 (blue) and the refolded SAA1 at 0.36 mg/mL (black), 0.18 mg/mL (red), and 0.06 mg/mL (cyan). (C) Size-exclusion chromatography comparison of native (blue) and Gn⋅HCl-treated his6SAA1.1 (green) with refolded SAA1.1 (red) on a Superdex 200 16/60 column. (D) Size-exclusion profile of MBP-SAA189 protein. (A and D) (Insets) SDS gels of the corresponding samples. mAU, milliabsorption unit.

