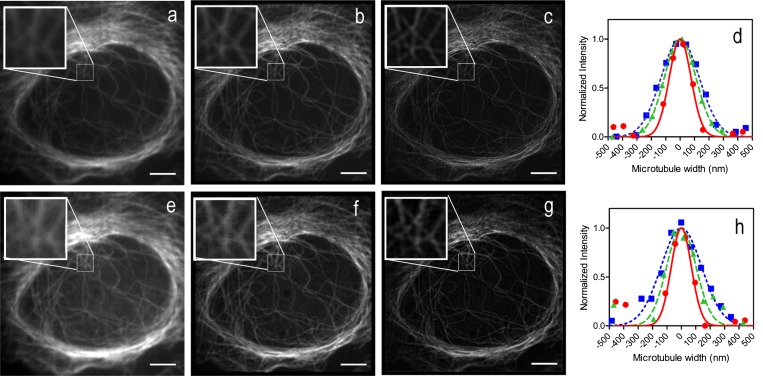
Fig. 1.
Both 1P- and 2P-MSIM double resolution. U2OS cells were labeled with an anti-tubulin antibody and imaged by (A–D) one- or (E–H) two-photon excitation. Widefield images of the same cell were produced by summing the fluorescence from the unprocessed images collected under (A) one- or (E) two-photon imaging. The processed MPSS images show the results of pinholing, scaling, and summing the data collected under (B) one- or (F) two-photon excitation. The images in B and F were deconvolved to produce the final (C) 1P- or (G) 2P-MSIM images. The Insets display magnified regions. The widths of microtubule filaments were measured for each of the three image types and example plots with their corresponding Gaussian fits are shown for (D) 1P- and (H) 2P-MSIM imaging. The widefield measurements (blue squares) and 1D Gaussian fits (dotted blue lines) show average FWHM ± SD of 350 ± 40 nm for 1P-MSIM imaging and 360 ± 30 nm for 2P-MSIM. Measurements on the intermediate MPSS images for 1P-MSIM (D, green triangles) and 2P-MSIM (H, green triangles) show an average of 240 ± 20 nm or 260 ± 30 nm FWHM determined from their respective fits (D and H, dashed green lines). Measurements on 1P-MSIM (D, red circles) and 2P-MSIM (H, red circles) images show average FWHM of 150 ± 20 nm and 160 ± 20 nm from their respective 1D Gaussian fits (D and H, solid red lines). For all measurements, the sample size is ≥30. (Scale bars: 5 µm.)

