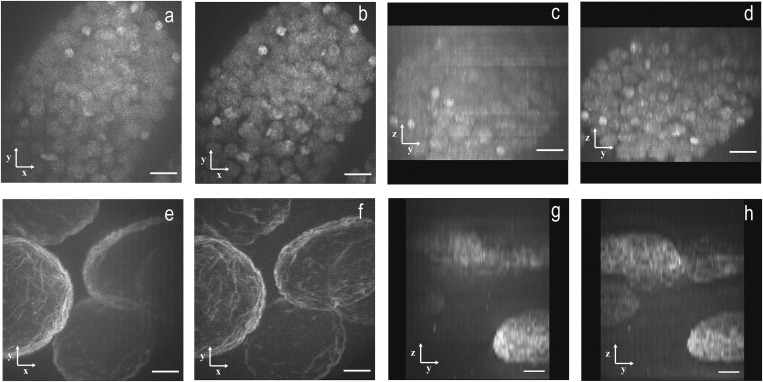
Fig. 3.
One- and two-photon MSIM imaging of C. elegans embryo and D. melanogaster salivary glands. The 1P- and 2P-MSIM imaging was performed on a C. elegans embryo expressing H2B-EGFP (A–D) using (A and C) 1P- and (B and D) 2P-MSIM. The images in a 25-µm volume are shown here as maximum-intensity (A and B) xy and as yz projections. Imaging was also performed on an Alexa Fluor 488 lamin-C–labeled D. melanogaster salivary gland using (E and G) 1P- and (F and H) 2P-MSIM, shown here as maximum-intensity xy and yz projections from a 50-μm volume. The optical axis is indicated by the z axis in YZ projections with increasing depth into the specimen displayed from bottom to top. (Scale bars: 5 µm.)

