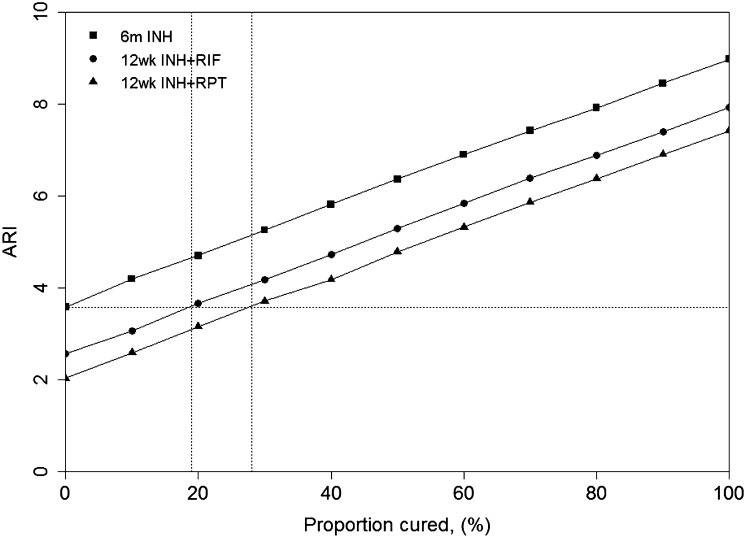
Fig. 2.
Estimated ARI for the Soweto trial. Symbols and solid lines show the estimated ARI (y axis) for each arm in the study as p, the proportion cured (x axis), is varied. Horizontal dashed line shows the estimated ARI assuming p = 0 for INH. Vertical dashed lines show the proportion cured by rifampicin and rifapentine assuming this ARI is the same across all arms. INH, isoniazid; RIF, rifampicine/rifampin; RPT, rifapentine; 6m, 6 mo; 12w, 12 wk.

