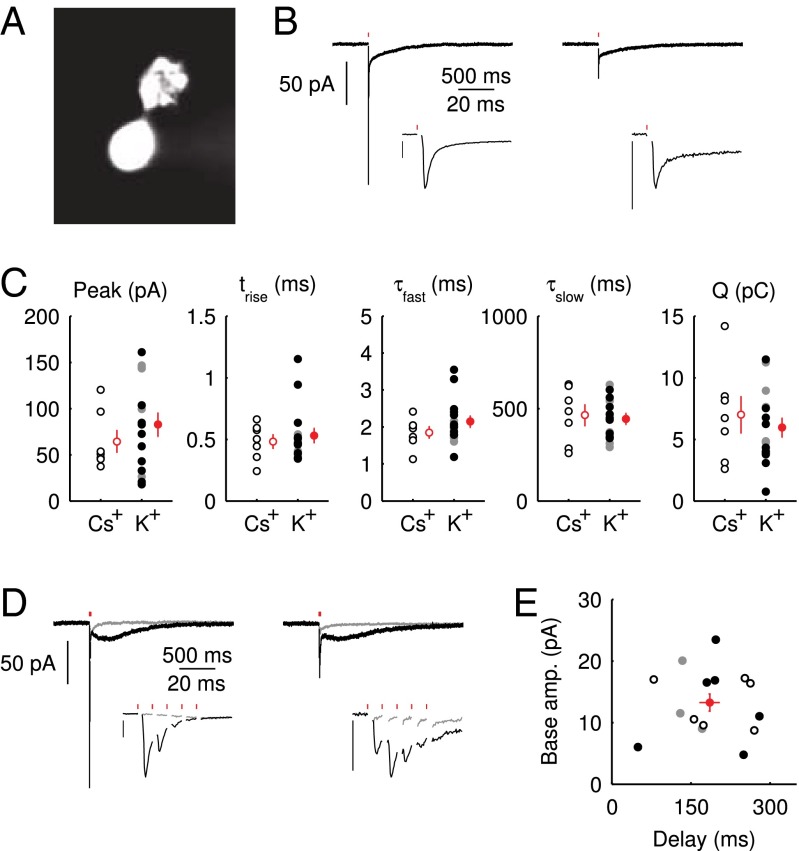
Fig. 1.
Properties of the EPSC. (A) Epifluorescence image of a UBC filled through the patch pipette with a fluorescent dye. (B) Example recordings of responses to a single presynaptic stimulus from two different UBCs. (Insets) enlargement of the fast EPSC. (Vertical scale bars, 50 pA.) Red markers indicate the time of stimulation; artifacts were removed for clarity. Traces are averages of 10 sweeps. (C) Summary of EPSC properties from 22 UBCs, Left to Right: peak amplitude,  rise time
  , decay time constant of the fast EPSC
  , decay time constant of the slow tail
  , and total charge transferred
  . Filled dots, K+-based internal. Open dots, Cs+-based internal. All data were taken at
  , except for the filled gray dots, which were taken at
  (n = 2) or
  (n = 3). Average and SEM are shown in red. (D) Response to burst stimulation
  of the same cells as in A, averages of five sweeps. (E) Amplitude vs. delay of the maximal slow EPSC from 15 UBCs.

