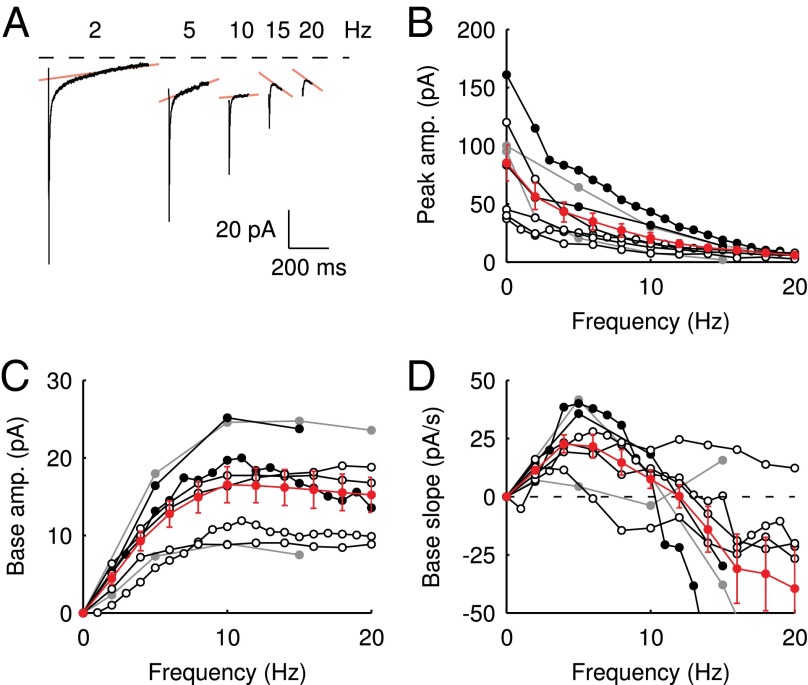
Fig. 2.
Steady-state EPSCs. (A) Examples of steady-state EPSCs, derived from regular stimulation protocols at increasing frequencies. The transparent red lines indicate the baseline slope, which is the slope of the EPSC just before stimulation. (B–D) Summary of steady-state EPSC peaks, baseline amplitudes, and baseline slopes, respectively, as a function of stimulation frequency for eight UBCs. As sample frequencies varied between cells, averages and SEM (red) were obtained by interpolation.

