Fig. 3.
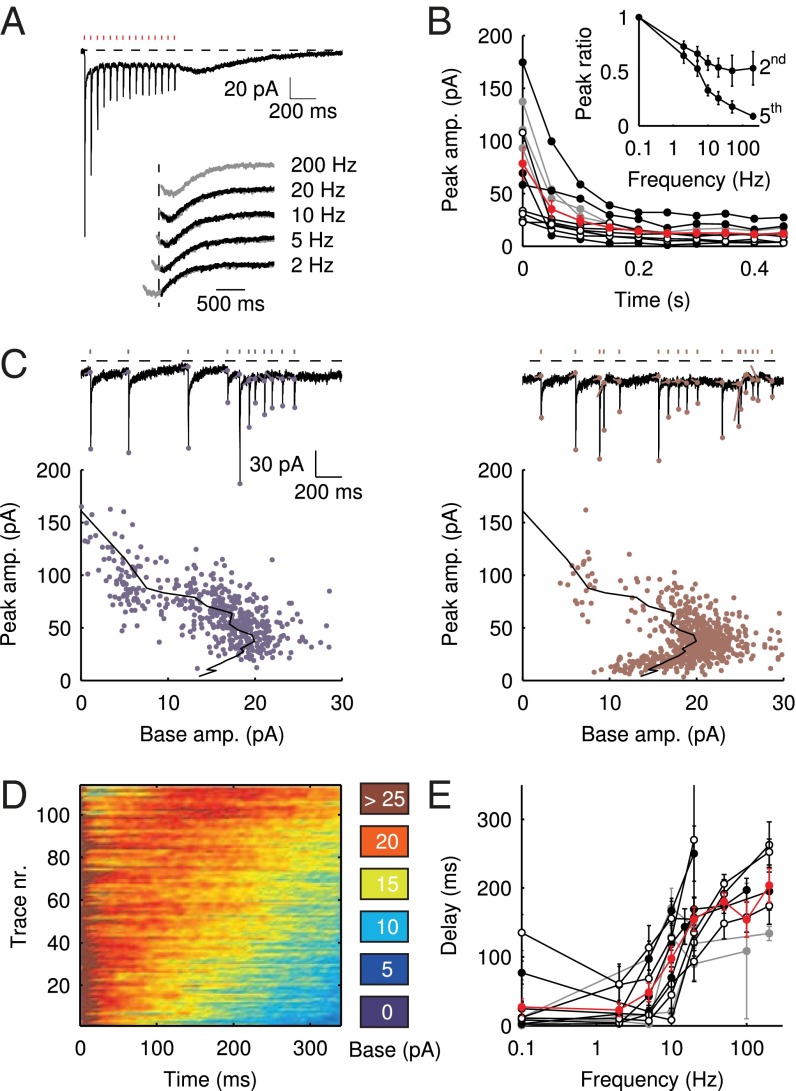
Delayed EPSC generation. (A) UBC response to a regular 20-Hz stimulus train. (Inset) Example traces of slow waves following regular stimulation at different frequencies. The 200-Hz curve was redrawn in gray beneath each trace for comparison. The vertical dotted line was drawn 20 ms after the final stimulus in the train. (B) Adaptation of EPSC peaks during 20-Hz stimulus trains  ; average and SEM are shown in red. (Inset) EPSC peak ratio (relative to the first EPSC) of the second and fifth peaks in a train, as a function of train stimulus frequency. (C) Example traces of responses to irregular stimulation (single sweep, 90 s) at average frequencies 5 (Upper Left, blue) and 10 Hz (Upper Right, red). Stimulation times, peaks of the fast EPSCs, and baseline currents before stimulations are indicated by markers. In the lower panels, EPSC peaks are plotted vs. the corresponding baseline currents for 5 (Lower Left, blue dots) and 10 Hz (Lower Right, red dots). Steady-state values derived from Fig. 2 are replotted here for this particular cell (black curve). (D) Heatmap of stacked traces of slow synaptic current during irregular stimulation of the cell in A. Traces with ISIs ≥ 350 ms were selected and sorted according to the value of baseline current at time 350 ms. (E) Latency of the maximal slow EPSC following regular stimulation, as a function of frequency for 11 UBCs. Individual curves resulted from at least five repetitions, and error bars indicate SD. The average curve is plotted in red, with error bars indicating SEM.

