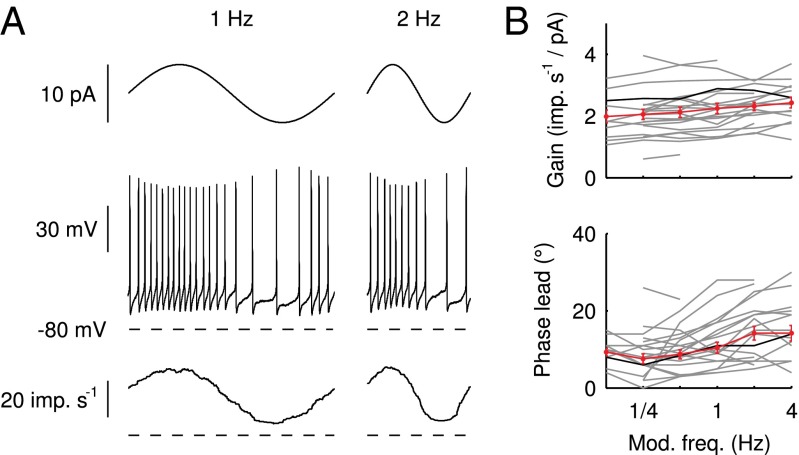
Fig. 5.
Modulation of action potential generation. (A) Examples of modulation of action potential firing in response to direct somatic injection of sinusoidal currents at 1 and 2 Hz. (Top) Injected current. (Middle) Recorded voltage. (Bottom) Average instantaneous firing rate from 20 (1 Hz) and 40 (2 Hz) sweeps. (B) Gain and phase of the input-output transformation as a function of sinusoidal frequency for a total of 21 UBCs. The trace corresponding to the example cell in A is shown in black; average and SEM are shown in red.

