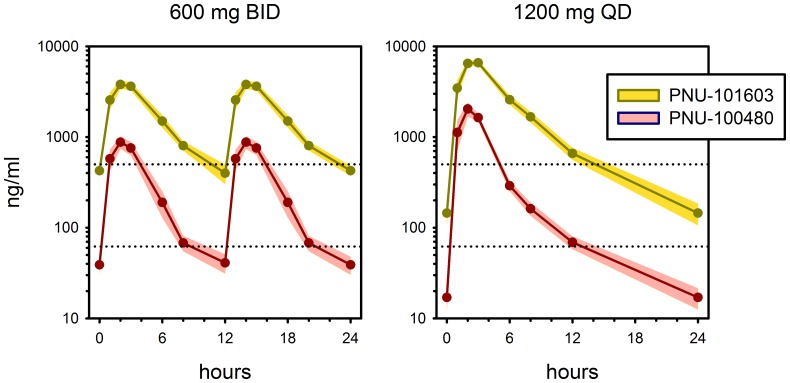
Figure 5. Plasma concentrations of sutezolid (pink) and its major metabolite (yellow) at steady state (day 13–14) in patients treated with sutezolid 600 mg BID (left) or 1200 mg QD (right).
Solid lines indicate medians; shading indicates 90% CI. Lower and upper dotted lines indicate median pre-treatment MIC values for parent and metabolite, respectively.

