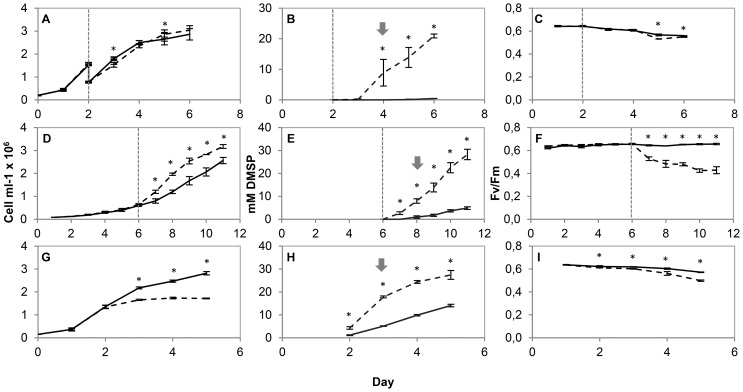
Figure 2. Regulation of DMSP concentration.
The effect of increased salinity (A,B,C; solid line indicates cultures maintained at 10 psu and dashed line indicates cultures transferred to 35 psu), increased light intensity (D,E,F,; solid line indicates cultures maintained at 50 µmols m−2 s−1 and dashed line indicates cultures transferred to 1000 µmols m−2 s−1) and nitrogen starvation (G,H,I; solid line indicates nitrogen replete cultures and dashed line indicates nitrogen starved cultures) on cell number (A,D,G), the DMSP concentration (B,E,H) and Fv/Fm (C,F,I) of Thalassiosira pseudonana. Results are shown as means ± standard deviation from 3 independent cultures. The vertical line indicates the point at which the salinity/light intensity of the cultures was adjusted. Asterisks show t-test, P<0.05. Arrows indicate the point at which cultures were sampled for proteomics and gene expression analysis.

