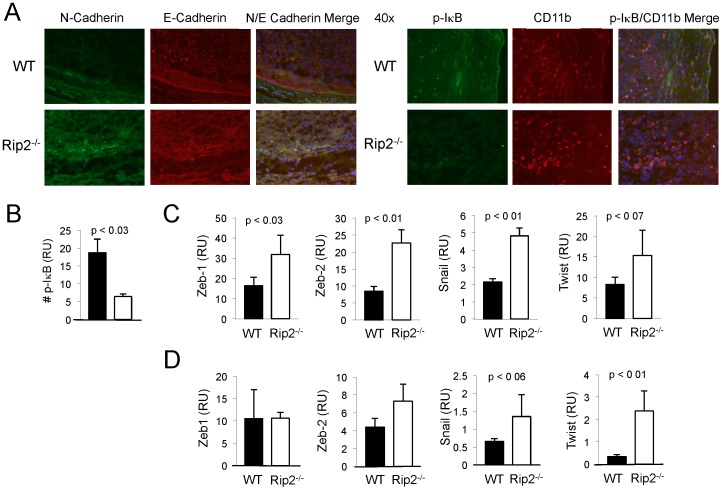
Figure 6. Enhanced epithelial-to-mesenchymal transition in tumors from Rip2-deficient mice.
A, Rip2+/+ and Rip2−/− mice intravesically implanted with MB49 cells for 12 days were assessed for E-cadherin and N-cadherin expression by immunofluorescence. Magnification of x40. Data are representative of two independent experiments. B, Bar graphs below enumerate mean number of cells per x40 field of 3 representative sections from groups of four mice; bars, SD. C, Expression of zeb-1, zeb-2, snail, and twist were examined from CD45− dissociated total tumor tissue by qPCR. Column, mean of four mice; bars SD. Data are representative of two independent experiments. D, Expression of zeb-1, zeb-2, snail, and twist were examined from dissociated lungs containing metastases by qPCR. Column, mean of four mice; bars SD. All p values were determined by two-tailed Student's t test, with statistically significance defined as p<0.05.

