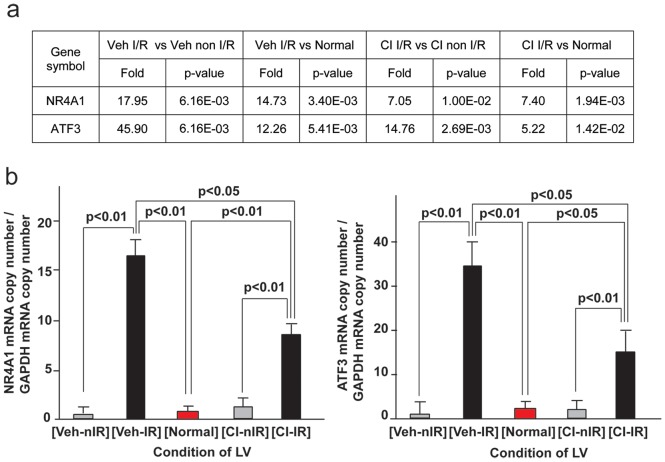
Figure 4. Regulation of NR4A1 mRNA in normal, vehicle and CI treated dog LV I/R and non-I/R regions by microarray and RT-PCR.
Table (a) demonstrates Genesping GX.11 fold change from microarray and p value for mRNA intensity value of NR4A1 and ATF3 in normal, I/R and non-I/R vehicle- and CI-treated dog LV. Panel b demonstrates real-time RT-PCR validation of NR4A1 (left) and ATF3 (right) mRNA in normal, I/R and non-I/R vehicle- (Veh-nIR) and CI-treated dog LV. Normal dog, n = 5; Veh dog, n = 6; CI dog, n = 6.

