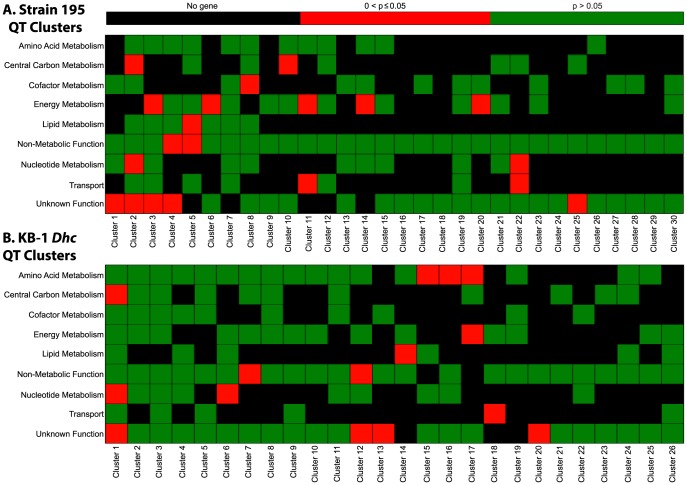
Figure 5. Functional enrichment analysis of QT clusters for (A) strain 195 and (B) KB-1 Dhc array data.
Genes in each QT cluster were categorized according to the subsystems or functional categories of D. mccartyi metabolic model. Next, enrichment p-values were calculated using hypergeometric distribution for each QT cluster to identify which clusters were enriched with genes from a particular subsystem. This analysis identified 13 and 11 clusters of co-expressed genes for strain 195 and KB-1 Dhc, which were significantly overrepresented by genes from specific functional categories. Such functionally enriched clusters are shaded in red (p≤0.05) while black (No gene) indicates the absence of a gene from the corresponding subsystems, and green represents non-significant p-values (p>0.05) for the clusters.

