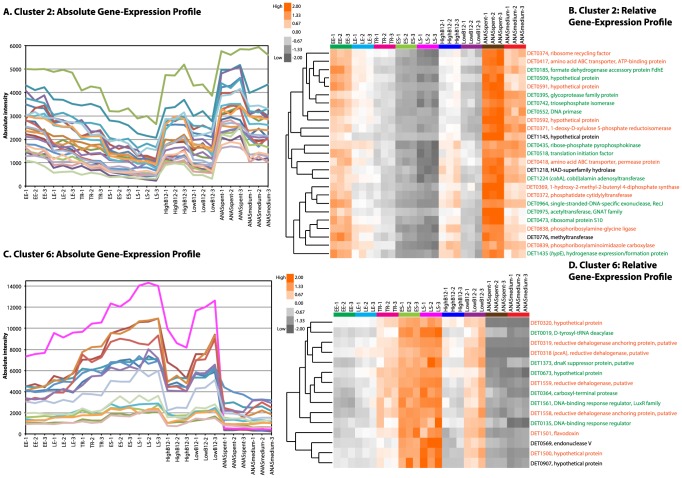
Figure 6. Analysis of two functionally enriched strain 195 QT clusters.
Two functionally enriched and interesting QT clusters (clusters 2 and 6) of strain 195 transcriptomic data were further analyzed by the hierarchical clustering algorithm as represented by the dendrograms in (B) and (D). Absolute gene expression intensities of the clusters are plotted in (A) and (C), while relative or normalized gene expression intensities (see Materials and methods) are presented as heat maps in (B) and (D). The height of the dendrograms represents the similarity of gene transcription patterns and is measured by the Spearman's rank correlation coefficient (SCC). Genes whose names are in green or orange are part of an operon, but orange further indicates that multiple genes from the same operon are present in the cluster.

