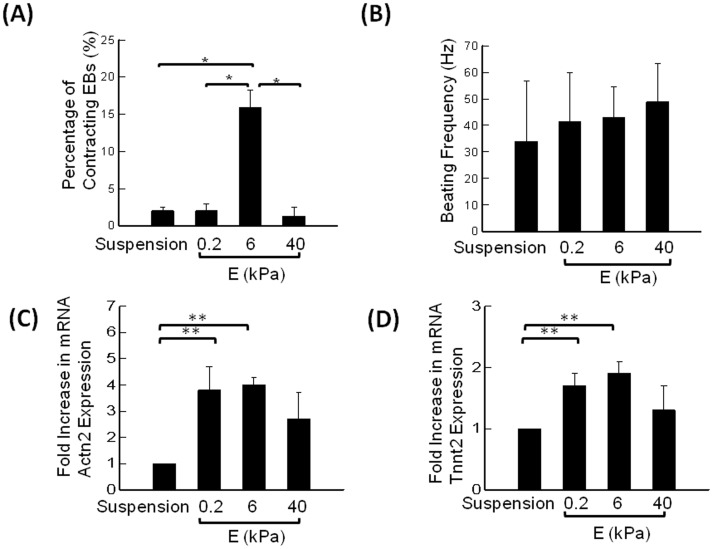
Figure 4. Analysis of stiffness-modulated contraction in EBs.
(A) Percentage of contracting EBs. The difference of the values between EBs cultured on the gel with E of 6 kPa and other three conditions is statistically significant (*p<0.05). Values and error bars represent the mean and the standard error of at least 100 EBs, respectively. (B) Frequency of EB contractions. Values and error bars represent the mean and the standard deviation of at least 5 EBs, respectively. (C) Effects of E of the hydrogel on the sarcomeric α-actinin (Actn2) mRNA expression. (D) Effects of E of the hydrogel on cardiac troponin T type 2 (Tnnt2) mRNA expression. Values and error bars represent the mean and the standard error. In (C) and (D), * indicate statistical significance of difference between conditions (*p<0.05).

