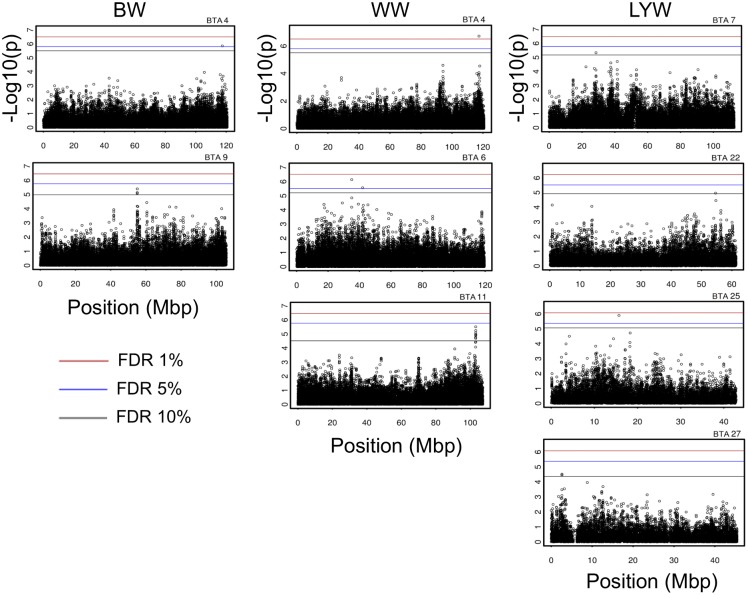
Figure 1. Manhattan plots of p-values for birth weight (BW), weaning weight (WW), and long-yearling weight (LYW).
Significance levels were determined by false discovery rate (FDR) correction at levels of 1% (red line), 5% (blue line), and 10% (black line). Positions were presented in megabase pair (Mbp). Associations were observed in autosome (BTA) 4, 6, 7, 9, 11, 22, 25, and 27.

