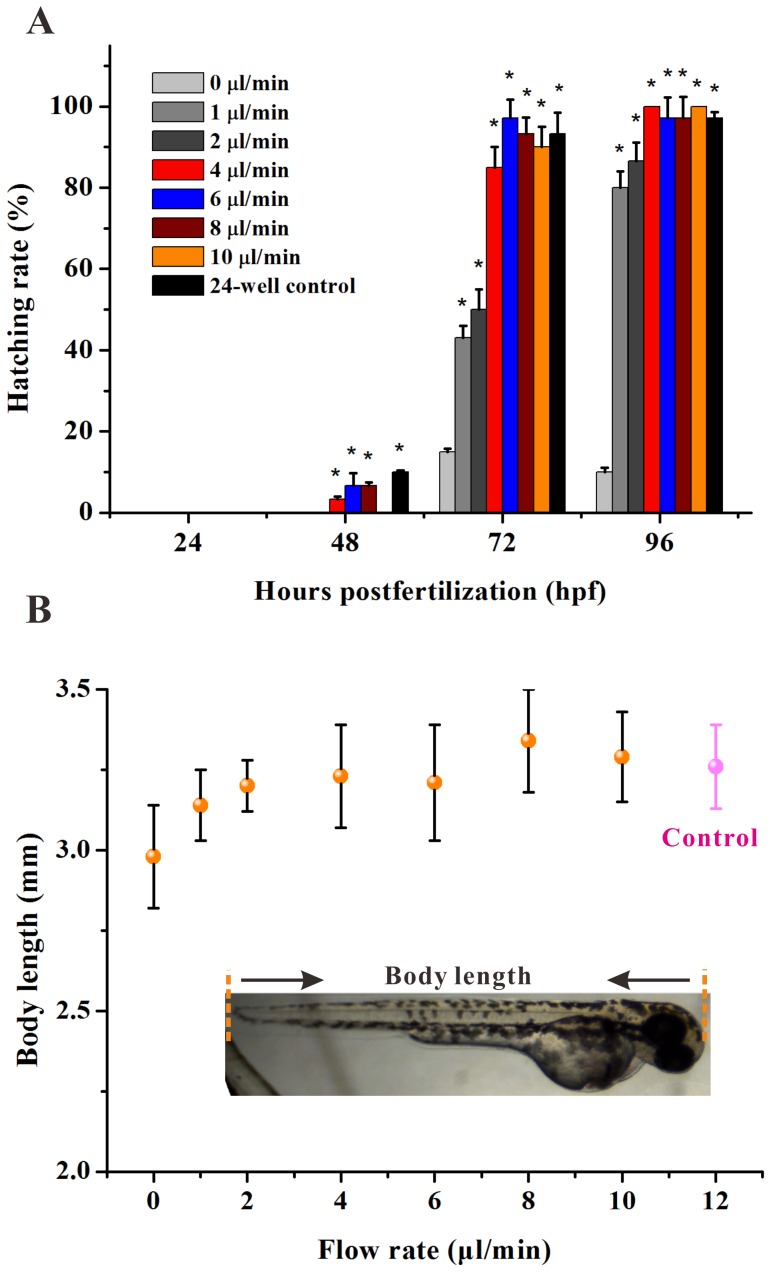
Figure 3. Development of Zebrafish embryos in microfluidic chip under flowing stream.
(A) Hatching percentage of embryos cultured in the chip by continuous exposure at varied flow rates and at different growth periods. The asterisks indicate significant differences from control group (chamber 1) * at p<0.05. (B) The body length of the larvae fish at 96 hpf (n = 20) cultured in the chip by continuous exposure at varied flow rates (pink control is body length of the larvae fish cultured in 24 microwells).

