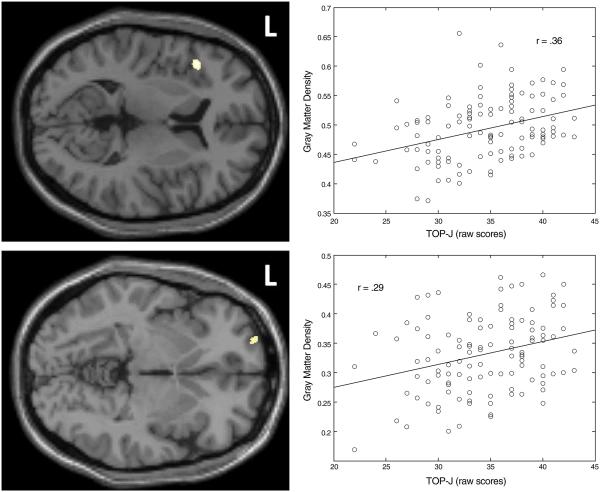
Fig. 1.
Locations and plots of the two significant clusters for which a relationship exists between judgment and GM density at a threshold of punc<.001 (Top=Left inferior frontal gyrus; Bottom=Left superior frontal gyrus). The respective plots represent the linear relationship between TOP-J scores and the first eigenvariate of the plotted cluster. Covariates were age, years of education, gender, ICV, CVLT-II memory scores, and WAIS-III Info scores

