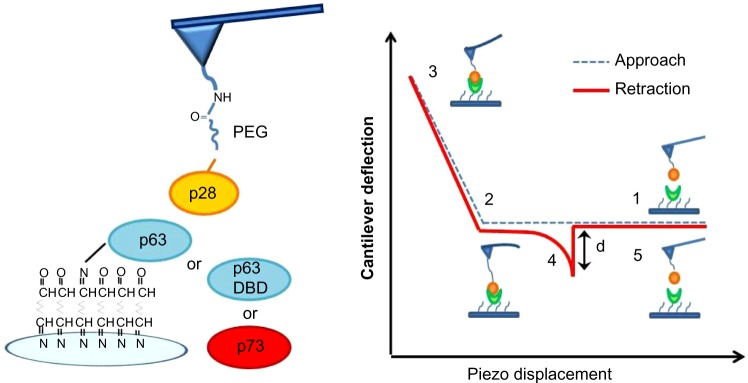
Figure 3.

Schematic representation of AFS analysis.
Notes: Left panel shows illustration of AFS analysis showing the p28 bound to the tip via a flexible linker and p63, p73, or p63 DBD immobilized on glass substrates. Right panel shows schematic representation of a force–piezo displacement cycle, showing a typical unbinding event.
Abbreviations: AFS, atomic force spectroscopy; DBD, DNA-binding domain.
