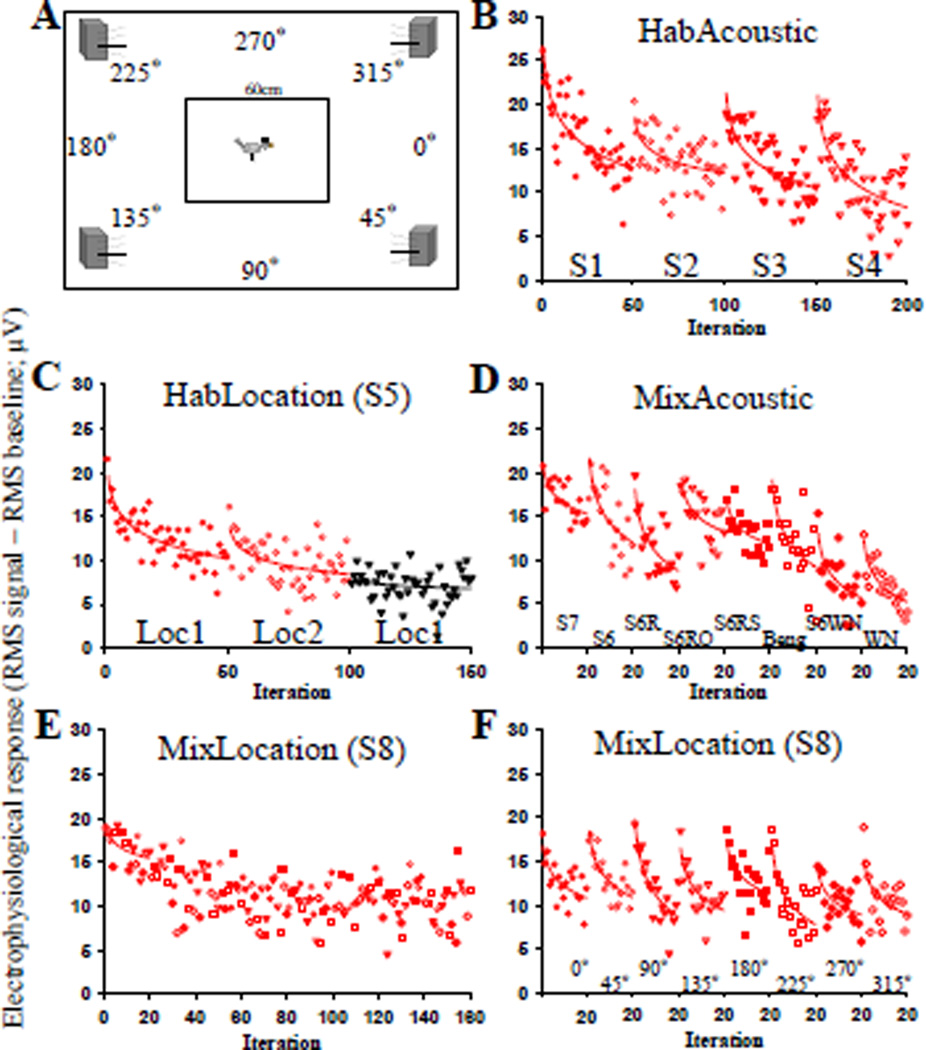
Figure 3.
Experimental schematic and main habituation findings. All data in this figure are from electrode 4 (CM) of Bird 2. For all data from all birds, see Figs. S3–S7. A. Schematic of the physical set-up, approximately to scale. The bird is housed in the cage in the center, with 4 speakers surrounding it. Angles indicate directions from which the sound was played in the MixLocation condition. B. Example of multi-unit responses to 50 repeated presentations each of 4 different songs (S1-S4, symbols). Lines represent logarithmic regressions. Red color indicates a significant habituation to that song (p< 0.05). The responses plotted here have not been normalized to the intercept of the curve. This allows us to see differences in overall average response to each stimulus. C. Example of multi-unit responses to the same song (S5) played 50 consecutive times each from two different diagonally opposite locations (Loc1 and Loc2) , followed by another 50 iterations from the original speaker again. D. Example of multi-unit responses to interleaved stimulation played 20 times at 8 different acoustic stimuli (for all data, see figure S5). The eight stimuli were played in random order, after which the whole set was repeated in a new random order, etc, until the whole set had been repeated 20 times. The responses to the same stimulus have been grouped together to visualize the change in response to repeated stimulation with the same stimulus, even if interleaved with other stimuli. E. Example of multi-unit responses to interleaved stimulation with the same song (S8) from 8 different spatial locations. The stimulus was played from the eight locations in random order, after which the whole set was repeated in a new random order, etc, until the whole set had been repeated 20 times. The responses are plotted in chronological order of presentation, regardless of the spatial location of the stimulus (for all data, see figure S6). F. Same data as in (E), with the responses to the same location grouped together in order to visualize the change in response to repeated stimulation from the same location, even if interleaved with stimulation from other locations (for all data, see figure S7).

