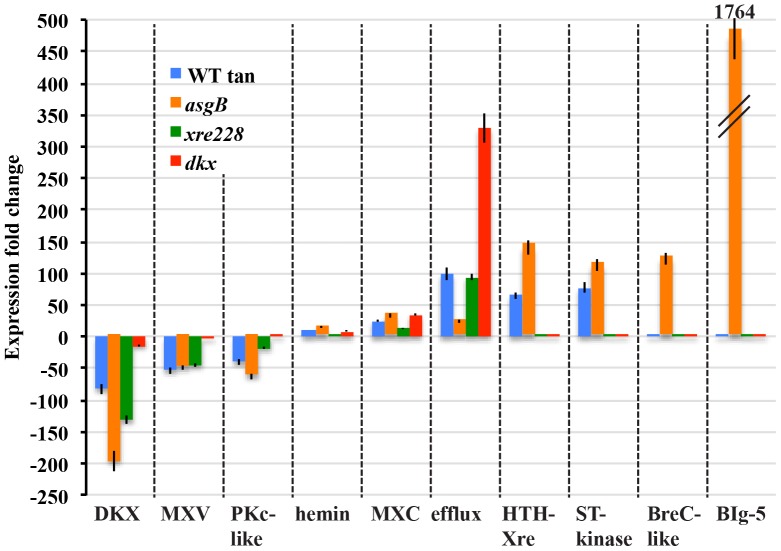
Figure 7. Potential biomarkers of phase variation.
A side-by side comparison illustrates the magnitude of changes between the tan variant and the mutants and highlights some of the outliers. Eight of the ten markers (genes or operons) show significant changes in the WT-T, while the remaining two genes represent changes that are unique to the asgB mutant. The fold change for gene operons represents the average of all genes in the pathway. DKX represents the average of the 14 DKxanthene genes (MXAN_4289-4305), MXV represents the average of 21 myxovirescin genes (MXAN_3930-3950), pKc represents the average of four protein kinase-like genes (MXAN_1234, 2177, 3183, 4841), hemin represents the average of nine myxochelin genes (MXAN_3639-3647), efflux represents the average of four macrolide efflux genes (MXAN_4198-4201), HTH-Xre represents the average of four xenobiotic response element genes (MXAN_4372, 4480, 4481, 6998), and ST_kinase represents the average of seven protein kinases (MXAN_2399 2840, 4371, 4373, 4479, 7370, 7371). BreC is MXAN_0383 and BIg-5 is the average of MXAN_7217 and 7219, which at fold increase of 1764, was off the scale of this graph.

