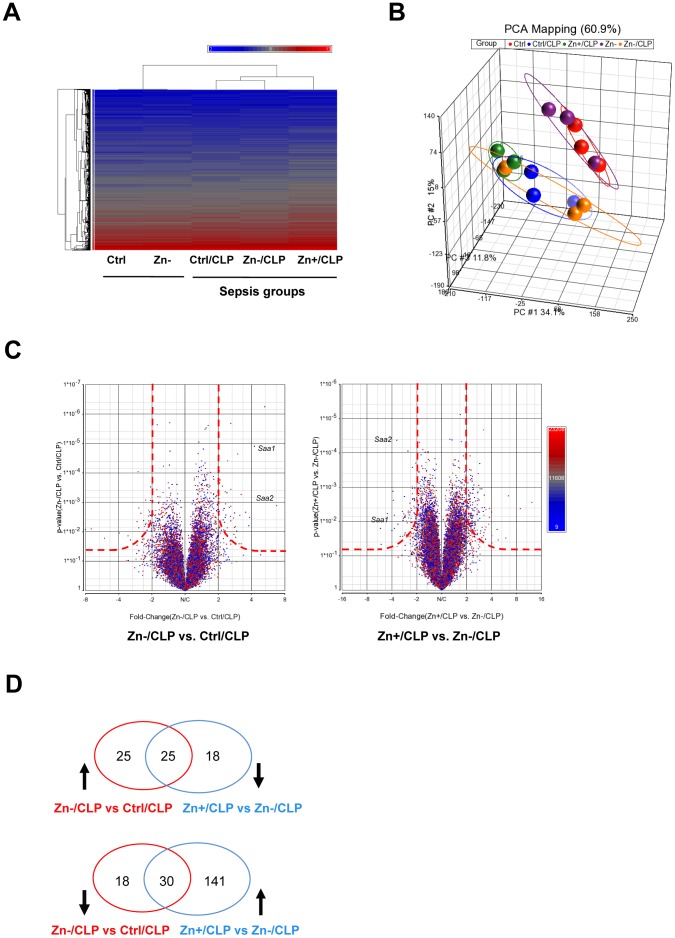
Figure 1. Genome profiling of mouse lung tissue in the combined setting of cecal ligation and puncture (CLP)-induced sepsis and modified Zn diets.
(A) A two-dimensional gene cluster map is shown representing the entire genome (>20,000 genes) that are differentially regulated between Ctrl, Zn- (Zn deficiency), CLP alone (Ctrl/CLP), Zn deficiency with CLP (Zn-/CLP), and Zn supplementation with CLP (Zn+/CLP) treatment groups (The mean values are expressed as the average from 3 mice per group for heatmap analysis). C57/B6 mice were administered a control diet (Ctrl), Zn-deficient (Zn-) diet, or a Zn-deficient diet for 18 days followed by oral Zn-supplementation (Zn+) diet for 3 more days. The three week dietary regimes were then followed by CLP and tissue harvest at 24 hrs post CLP and then microarray analysis. (B) Principal component analysis revealed distinct relationships between different groups. CLP alone resulted in a significant change in global gene expression, compared to non-CLP groups, which was further influenced by Zn status. (C) The adjacent volcano plots illustrate that multiple genes are differentially influenced by Zn status and that Saa1 and Saa2 are two of the most “Zn responsive” genes in the setting of CLP. The cut-off boundary is shown as a red dash line. (D) The Venn diagram summarizes the number of “Zn-responsive” genes in the setting of CLP. Specifically, the number of “Zn-responsive genes” is shown at the intersection generated when we compared different treatment groups as already described.

