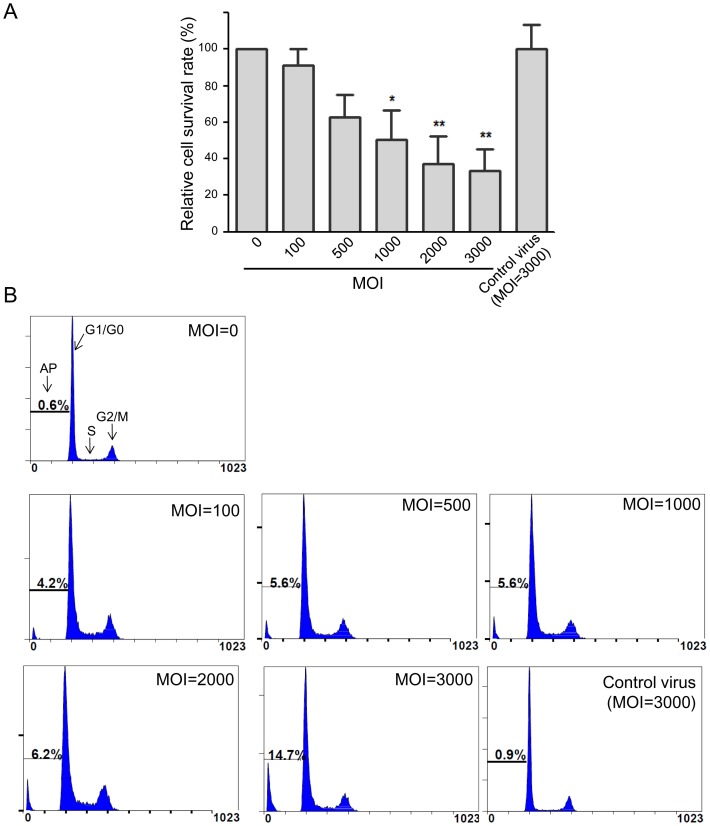
Figure 3. Characterization of HNF1α-transfected Hep G2 cells with various MOI 7 days post-infection.
(A) The relative survival rate decreased as the viral MOI increased. (B) Cell cycle analysis revealed the percentage of apoptotic cells increased as the MOI increased. AP: apoptotic cells; G1/G0: G1/G0 phase; S: S phase; G2/M: G2/M phase. Control virus with MOI = 3,000 did not affect cell survival or apoptosis. *P<0.05, **P<0.01.

