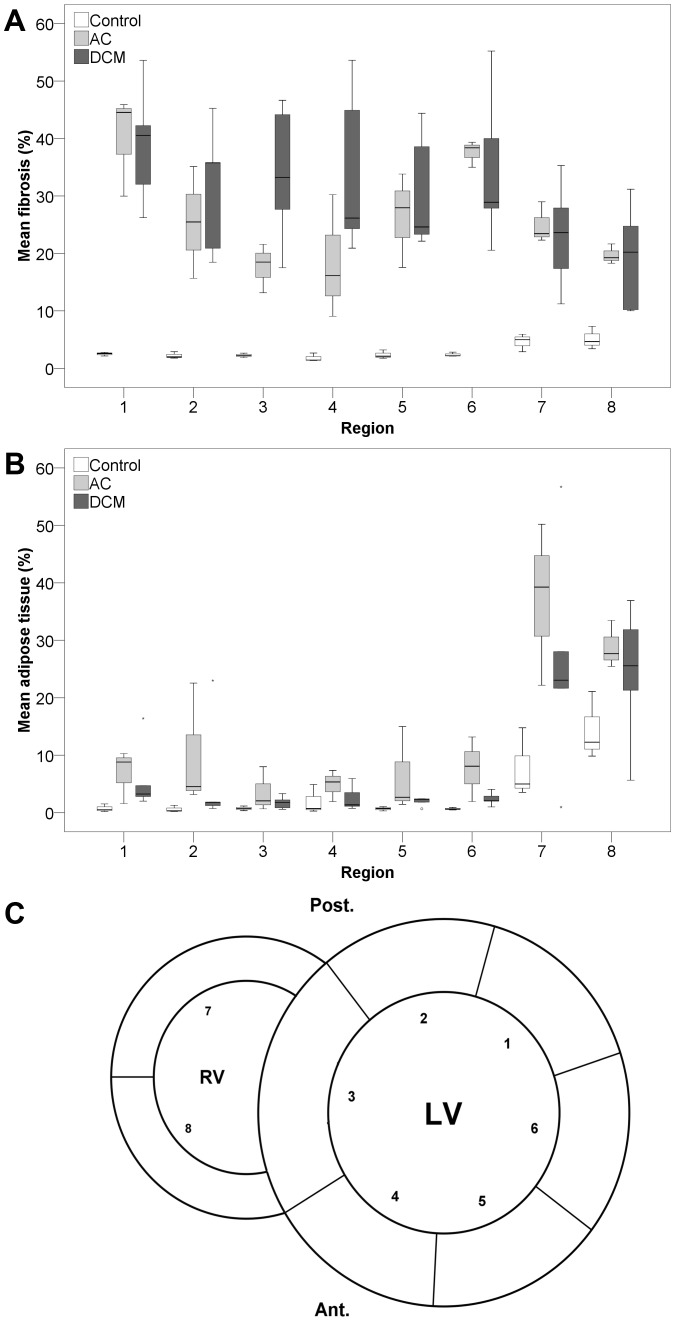
Figure 6. Boxplots of mean fibrosis and mean adipose tissue in the different regions.
Boxplots of mean percentage of fibrosis (A) and adipose tissue (B) per condition in 8 regions (C) corrected for surface area. Outliers are represented by small circles or stars. AC, arrhythmogenic cardiomyopathy; DCM, dilated cardiomyopathy; LV, left ventricle; RV, right ventricle; Ant., anterior; Post., posterior; 1 = LV posterolateral wall; 2 = LV posterior wall; 3 = interventricular septum; 4 = LV anterior wall; 5 = LV anterolateral wall; 6 = LV lateral wall; 7 = RV posterior wall; 8 = RV anterior wall.

