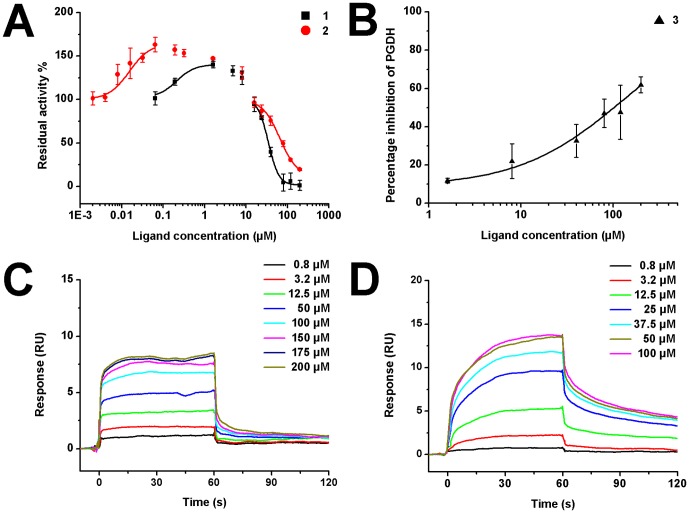
Figure 3. Dose-response curves of compounds 1-3.
(A) Residual enzyme activity versus compound concentration. The IC50 values were 34.8±1.3 for compound 1, and 58.0±9.0 µM for compound 2. The AC50 value was 34.7±4.5 nM for compound 2. (B) Enzyme inhibition dose-response curves of compound 3. The fitted IC50 value was 131±12 µM. (C–D) SPR dose-response curves of compound 1, compound 2 with immobilized PGDH, respectively. The KD values were 42.6±2.1 for compound 1 (C), and 19.0±1.9 µM for compound 2 (D). KD values of the compounds 1 and 2 were obtained by fitting the data sets to 1:1 Langmuir binding model using Biacore T200 Evaluation Software. Residuals for all SPR sensorgrams were less than 2 RU. Chi-square values were 2.4 for C and 1.2 for D.

