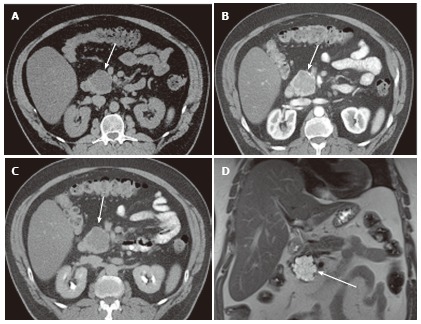
Figure 1.

A 65-year-old male with clinically diagnosed typical microcystic serous cystic neoplasm. A: Unenhanced axial computed tomography (CT) shows a low density mass (arrow) relative to the pancreatic head; B: The pancreatic parenchymal phase of a contrast-enhanced CT shows mild patchy tumor enhancement (arrow); C: The equilibrium phase shows the mass to be low density (arrow); D: Coronal T2-weighted single-shot fat saturation-echo magnetic resonance image clearly demonstrate the mass (arrow) consisting of a cluster of microcysts (honeycomb pattern).
