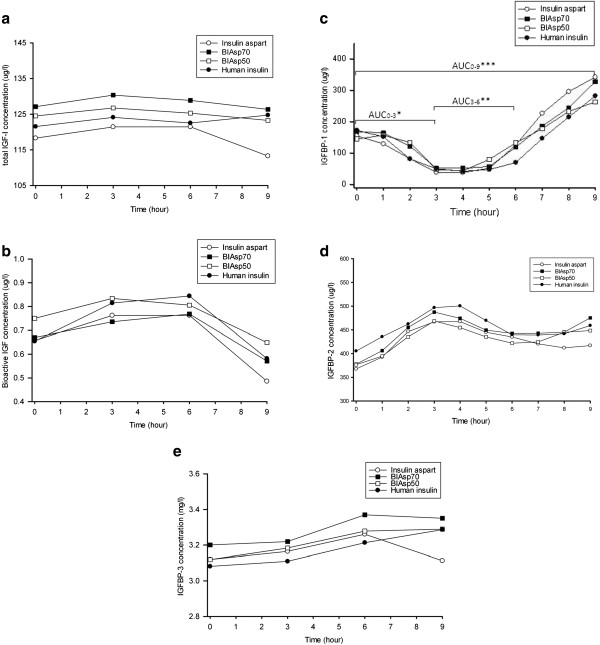
Figure 2.
IGF parameters profiles. (a) Serum total IGF-I concentration, (b) bioactive IGF concentration, (c) IGFBP-1 concentration, *P < 0.01 as BIAsp50 compared with insulin aspart and human insulin for AUC0–3; **P < 0.05, as BIAsp50 compared with human insulin for AUC3–6; ***P < 0.05, as BIAsp70 compared with human insulin for AUC0–9.(d) IGFBP-2 levels and (e) IGFBP-3 levels during 9-hour treatment with insulin aspart (open circles), BIAsp70 (black rectangles), BIAsp50 (open rectangles) and human insulin (black circles). For clarity, serum concentrations are illustrated as mean levels only.

