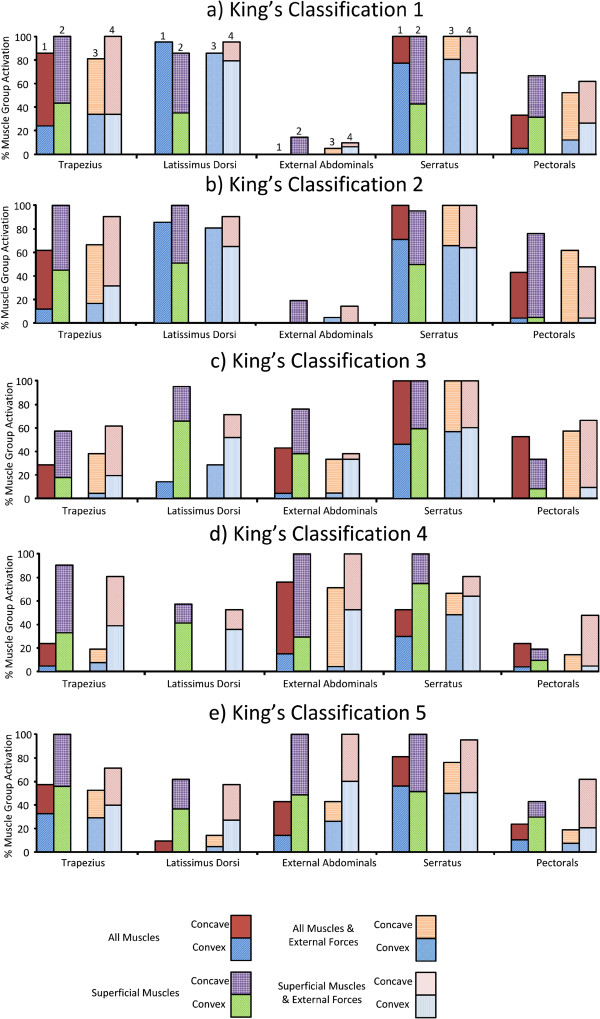
Figure 3.
Superficial Muscles: The percentage of optimizations for which each superficial muscle group was selected for activation for the individual King’s classifications (a-e). Column 1 illustrates the result for when superficial and deep muscles were included in the model. Column 2 illustrates the result for when only superficial muscles were included in the model. Columns 3 and 4 illustrate the equivalent results with the addition of applied external forces to the model. The graph also indicates which side of the thoracic curve that the muscles were located. The top area of each column represents the concave side, while the bottom area represents the convex side.

