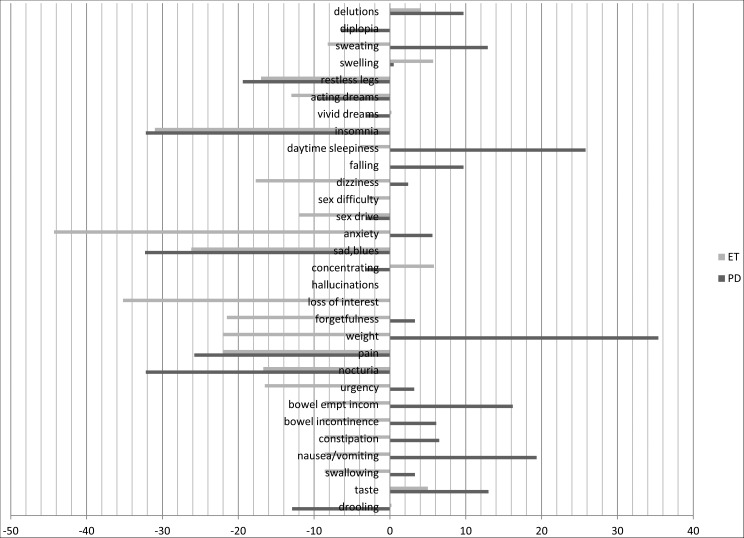
Figure 1. Percentage of Changes in the Declaration of Specific Non-motor Symptoms in both Parkinson's Disease and Essential Tremor Patients at Follow-up.
Columns represent the percentage variation in the number of declared non-motor symptoms at follow-up with respect to baseline (intended as 100% the global number of either Parkinson's disease or essential tremor patients).

